Quick answer: Tariffs can raise prices of U.S.-made goods as well as imports. New York Fed researchers identify imported-input costs and reduced competitive pressure as indirect channels. That makes the October 6 research relevant beyond the imported-goods aisle—and means a fading inflation effect is not the same as an erased price increase.
Research reviewed October 10, 2026. This article explains a dated study and original hypothetical arithmetic, not today’s CPI release, a live price index or a forecast for every shopping basket.
What the New York Fed tariff study actually measures
The staff report, revised September 2026, estimates that about 26% of a tariff increase reaches consumer prices. It attributes 64% of the estimated effect to a direct channel and 36% to indirect channels. These are research estimates relative to less-exposed goods, holding aggregate conditions fixed—not a universal checkout-price rule.
The researchers’ October 6 explanation excludes services and oil from the studied consumer-goods sample. It describes imported-goods effects arriving sooner and domestic-goods effects building later. A one-year adjustment is a finding about transmission, not a promise that every price will reverse after a year. The authors distinguish the price level from the contribution to twelve-month inflation.
Why “made in the U.S.” is not a complete cost map
MGI reading framework: A final assembly location does not tell you where every input originates. Trace the product, its components and the competing products separately. Then ask what evidence supports a changed cost or selling price. This is an analytical checklist, not a claim that every domestic producer has identical exposure or pricing power. The study’s average mechanism should not become a prediction for an unexamined company.
Why zero inflation does not restore a $100 price
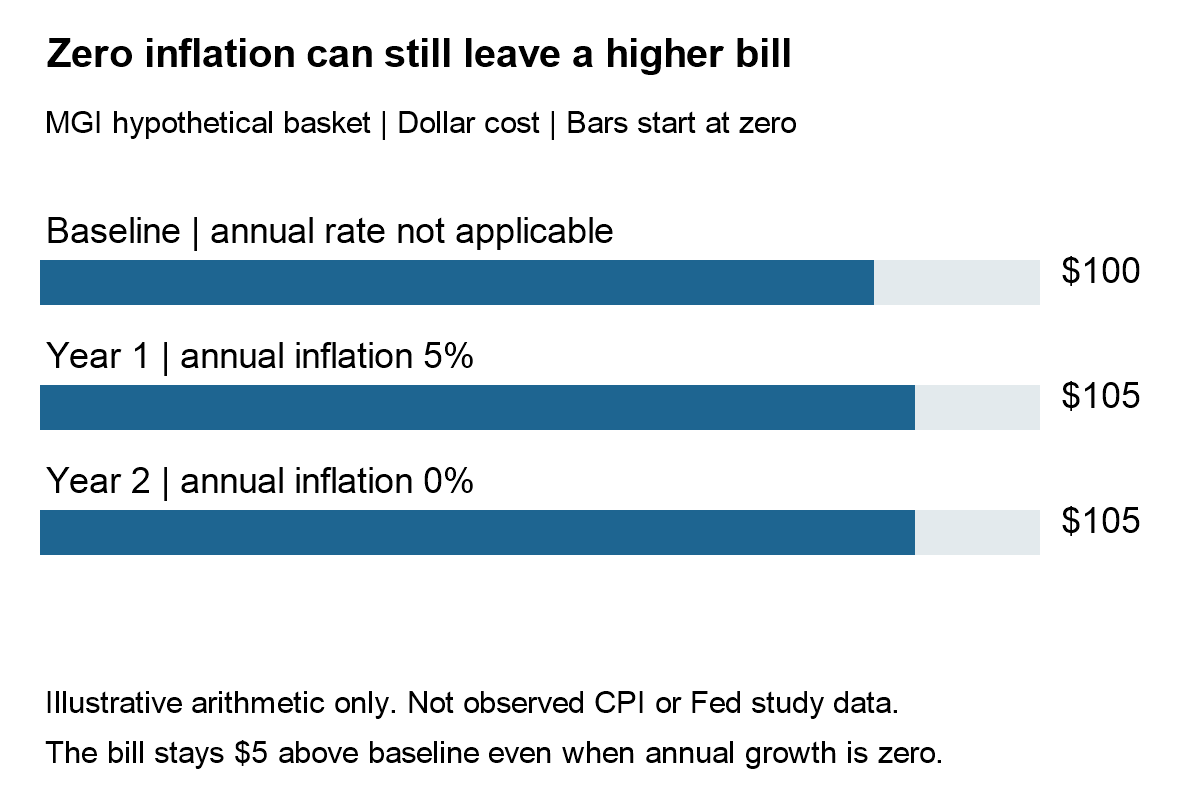
MGI hypothetical example: Consider a fictional basket costing $100 in a baseline year, $105 one year later and $105 the following year. Its year-over-year inflation rate moves from 5% to 0%. Its cost remains $5 above the baseline. This is ordinary arithmetic, not an observation of the research sample or a forecast of U.S. inflation.
| Period | Cost | Annual change | Above baseline |
|---|---|---|---|
| Baseline | $100 | Not applicable | $0 |
| Year 1 | $105 | 5% | $5 |
| Year 2 | $105 | 0% | $5 |
To return from $105 to $100, the basket would need a roughly 4.76% decline from its new level: 100 ÷ 105 − 1. A five-percent increase and a five-percent decrease do not cancel because the denominator changes. Always label the starting value before describing a reversal. For the broader concept, see our price-level versus inflation-rate guide; this article focuses on the new tariff research and its domestic-goods channel.
Four distinctions to check in a tariff inflation headline
| Distinction | Question to ask |
|---|---|
| Goods versus all spending | Does the estimate include housing, services and energy? |
| Level versus rate | Is the claim about a dollar price or its annual growth? |
| Observed versus modeled | Is this a measured outcome or a counterfactual estimate? |
| Average versus personal basket | Do the categories and weights match your own purchases? |
A counterfactual compares the observed world with an estimated alternative. It is useful for investigating a mechanism, but it is not an invoice that a household would definitely have paid. The words “holding other conditions fixed” also matter: they define the experiment rather than claiming every other economic force is irrelevant.
A practical household-budget test
Keep a short list of frequently purchased items and record price, package size, date and quantity. Compare the same unit and product rather than a smaller package with the same sticker price. Separately record how much you bought. Total spending can fall because quantity falls even while unit prices rise; it can rise because you bought more even when unit prices are unchanged.
That exercise does not prove which policy caused a price change. It simply makes your personal cost comparison consistent. Treat attribution as a separate research question requiring evidence. The strong-dollar and company-earnings guide explains why exchange-rate exposure is another distinction to keep visible instead of assigning every movement to one cause.
What investors should watch instead of assuming a rate cut
MGI interpretation: A fading historical tariff contribution alone cannot establish the next monetary-policy decision or a company’s next profit margin. Look for the actual reporting period, sales quantities, pricing, costs and management’s definitions. Our Fed hike-versus-pause analysis separates conditional signals from decisions, while the consumer-sentiment breakdown distinguishes perceptions from spending evidence.
Frequently asked questions
Does lower inflation mean everything becomes cheaper?
No. A slower positive rate still means a higher price level; even zero growth can leave an earlier increase intact.
Can I multiply any tariff by 26% to predict my bill?
No. A study estimate is not a product-specific quote or a forecast for your entire budget.
Sources provide research findings; the $100/$105 basket and reading checklist are MGI illustrations. Do not treat the research as a current all-items CPI statistic, official policy forecast or personal financial advice.