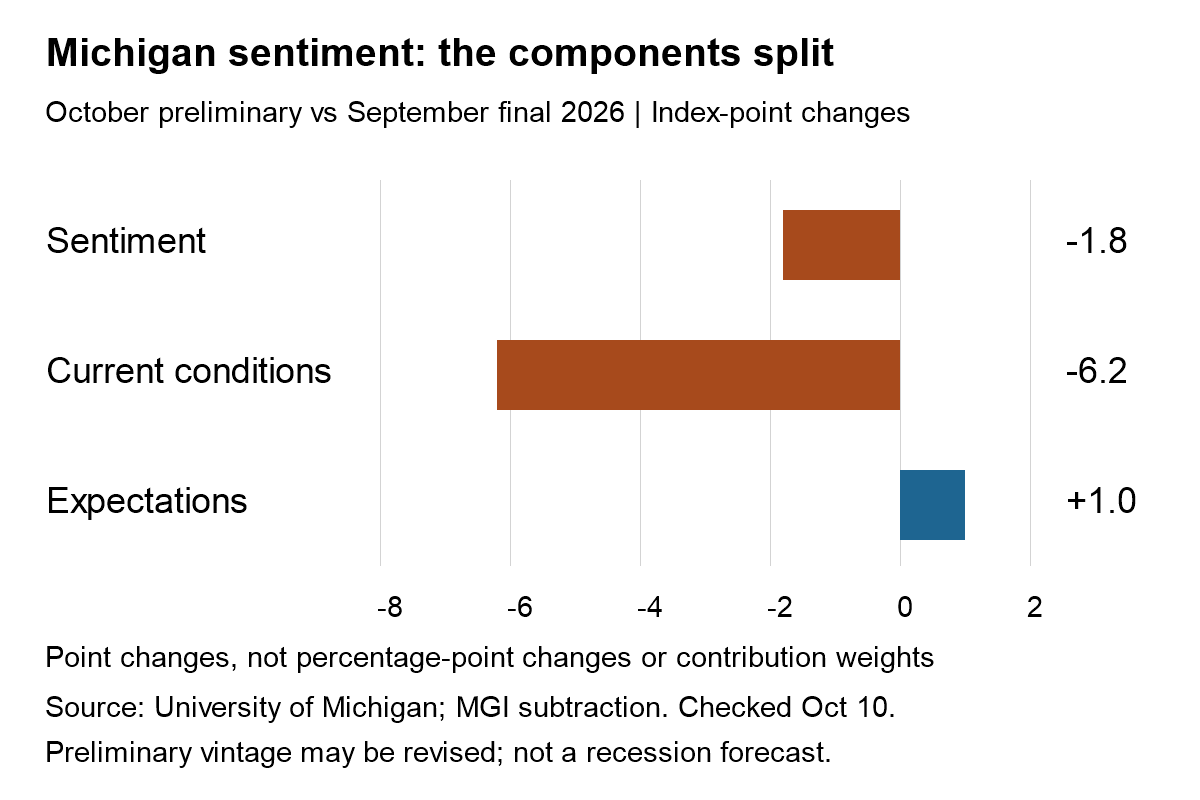
Quick answer: October’s preliminary consumer sentiment index fell to 46.3, but the headline does not mean every survey component deteriorated. Current conditions weakened while the expectations index increased. This measures consumer perceptions, not a confirmed decline in spending or an official recession declaration.
Evidence checked October 10, 2026 using the University of Michigan’s October preliminary results. The comparison is October preliminary versus September final, not two final releases. Preliminary readings can be revised.
Consumer sentiment: the split under 46.3
The University of Michigan’s official results show the following readings. The university’s next scheduled release is final October data on October 23 at 10 a.m. Eastern Time. The homepage changes over time; these figures are explicitly the October preliminary vintage checked here.
| Index | September final | October preliminary | Point change |
|---|---|---|---|
| Consumer sentiment | 48.1 | 46.3 | −1.8 |
| Current conditions | 50.9 | 44.7 | −6.2 |
| Consumer expectations | 46.3 | 47.3 | +1.0 |
MGI interpretation: “Consumers feel worse” is a reasonable headline shorthand, but it hides different directions underneath. It would be incorrect to claim from this table that the expectations index also fell. The index levels are not approval ratings: 46.3 does not mean 46.3% of Americans are confident.
Index points are not percentage points
Subtracting 48.1 from 46.3 gives −1.8 index points. Dividing that difference by 48.1 gives about −3.7% relative change. These describe the same move with different units. A 1.8-percentage-point decline would instead describe a change in a percentage-valued quantity, which this sentiment index is not.
Our chart shows the three point changes on a common zero-centered scale. It does not estimate how each component contributed to the composite’s change. The components should not be averaged or added without the survey’s weighting and calculation method.
Why sentiment is not the same as spending
The BEA consumer-spending guide describes personal consumption expenditures as the value of goods and services purchased by or on behalf of U.S. residents. That is a different measurement job from asking consumers how they perceive their situation.
Consider a hypothetical household whose monthly purchases remain $3,000 while an identical basket becomes more expensive. The household could feel worse about affordability without changing the dollar amount it spends. Conversely, the same dollar budget may buy less. This example does not establish October’s actual prices, income or consumption.
MGI framework: Compare perceptions with income, nominal spending and inflation-adjusted spending. A dollar-spending increase can reflect higher prices, more purchases or a changing mix. Do not turn a survey result into an unsupported estimate of retail sales or GDP.
Does 46.3 mean a recession has started?
No single sentiment reading proves that. The NBER business-cycle dating framework considers broader economic activity rather than treating one consumer survey as a mechanical recession threshold. This article makes no claim about a newly announced recession.
A practical distinction is evidence versus inference. “The survey weakened” is an observation. “Households will spend less next month” is a hypothesis to test. “The economy is in recession” requires a much broader basis. Treat those as three separate statements rather than substituting one for another.
What to watch next
- Compare the final October release with the preliminary vintage, not a mismatched September snapshot.
- Check whether the current-conditions and expectations split persists.
- Compare reported spending with its inflation-adjusted counterpart.
- Read company results for segment-level demand and margins, not a universal consumer conclusion.
Our PepsiCo earnings-quality analysis illustrates why corporate earnings and household perceptions answer different questions. Our mortgage buying-power calculation shows how borrowing costs can change a budget constraint without forecasting future purchases.
Frequently asked questions
Did all three Michigan indexes fall?
No. The expectations index increased in the comparison shown.
Is this final October data?
No. It is preliminary October data. Check the scheduled final release before replacing the vintage.
Official sources provide survey levels and measurement definitions; MGI supplies subtraction and hypothetical examples. No consensus estimate, search-volume figure or market-return forecast is invented. General economic education.