Bloom Energy Earnings: 138% Growth—What Margins Reveal
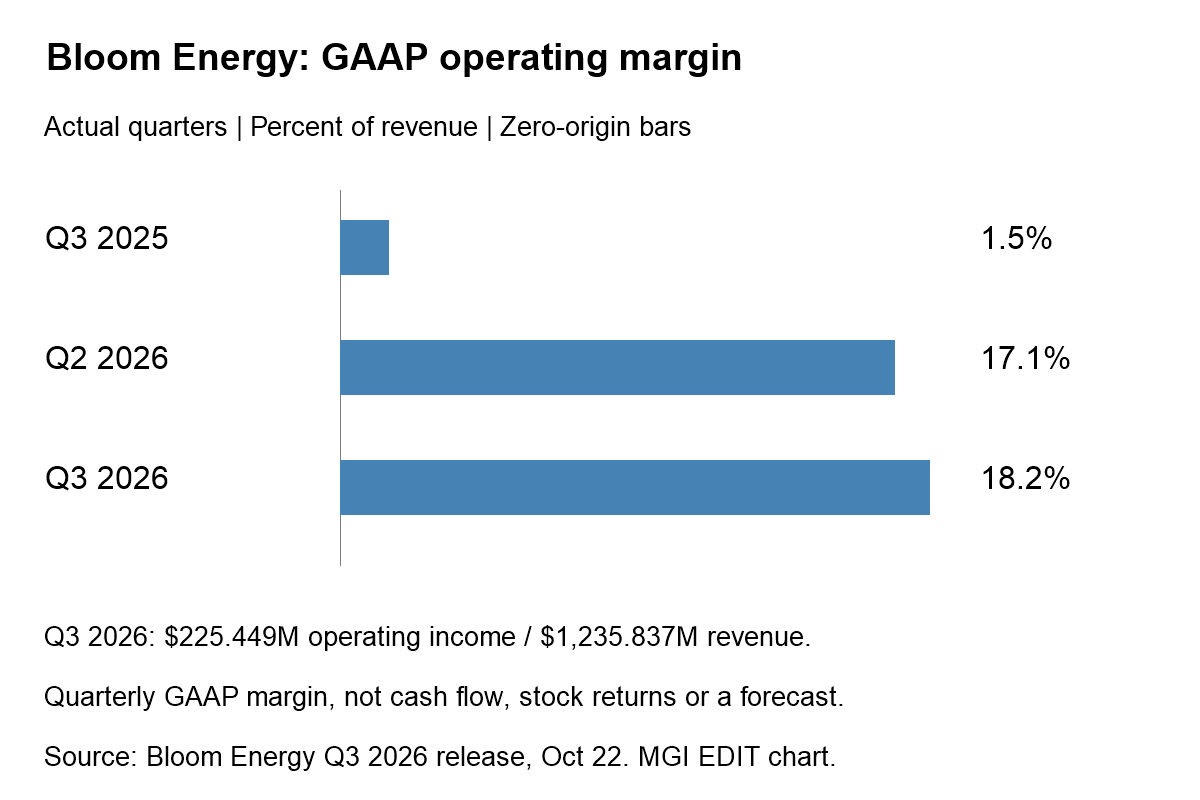
Bloom Energy GAAP operating margin: 1.5% in Q3 2025, 17.1% in Q2 2026 and 18.2% in Q3 2026. Actual quarters, not stock returns or forecasts.

Quick answer: Bloom Energy earnings for Q3 2026 paired 138.1% year-over-year revenue growth with an 18.2% GAAP operating margin. Those numbers answer different questions: growth measures expansion from a prior base, while margin measures operating profit per sales dollar. Neither is a promised return on BE stock. Checked October 23, 2026 against the company’s October … Read more
Tesla Q3 2026 Earnings: Cash Rebounds, Profit Falls 43%

Tesla Q3 2026 operating cash flow $6.263B minus capital expenditures $4.732B equals free cash flow $1.531B. Capex bar shows outflow magnitude.

Quick answer: Tesla Q3 2026 earnings show free cash flow turning positive at $1.531 billion, but still below the year-earlier quarter’s $3.990 billion. GAAP net income attributable to common stockholders was $787 million, down 43% year over year in the issuer’s table. “Positive cash flow” and “profit recovered” are not the same statement. Checked October … Read more

QQQ vs. QQQM: Is the $30 Fee Gap Worth Switching?

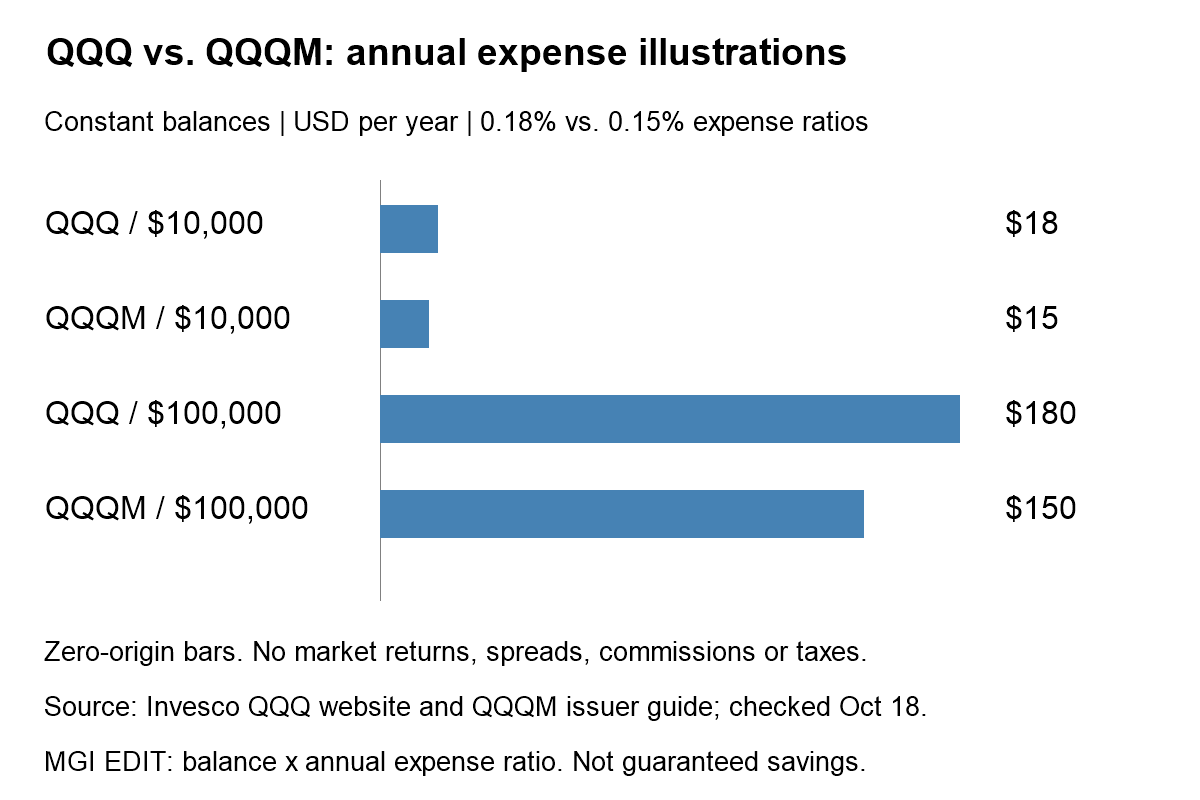
Illustrative annual QQQ and QQQM expenses at $10,000 and $100,000 balances, using 0.18% and 0.15% ratios; excludes trading costs and taxes.

Quick answer: Invesco documents checked for this comparison list QQQ’s annual expense ratio at 0.18% and QQQM’s at 0.15%. The difference is 3 basis points—about $30 a year per $100,000 at a constant balance. That is a cost comparison, not a promise that switching funds will improve your investment result. Prepared October 18, 2026; QQQ … Read more

AI Bubble? Why Record Earnings Can Still Mean Falling Stocks

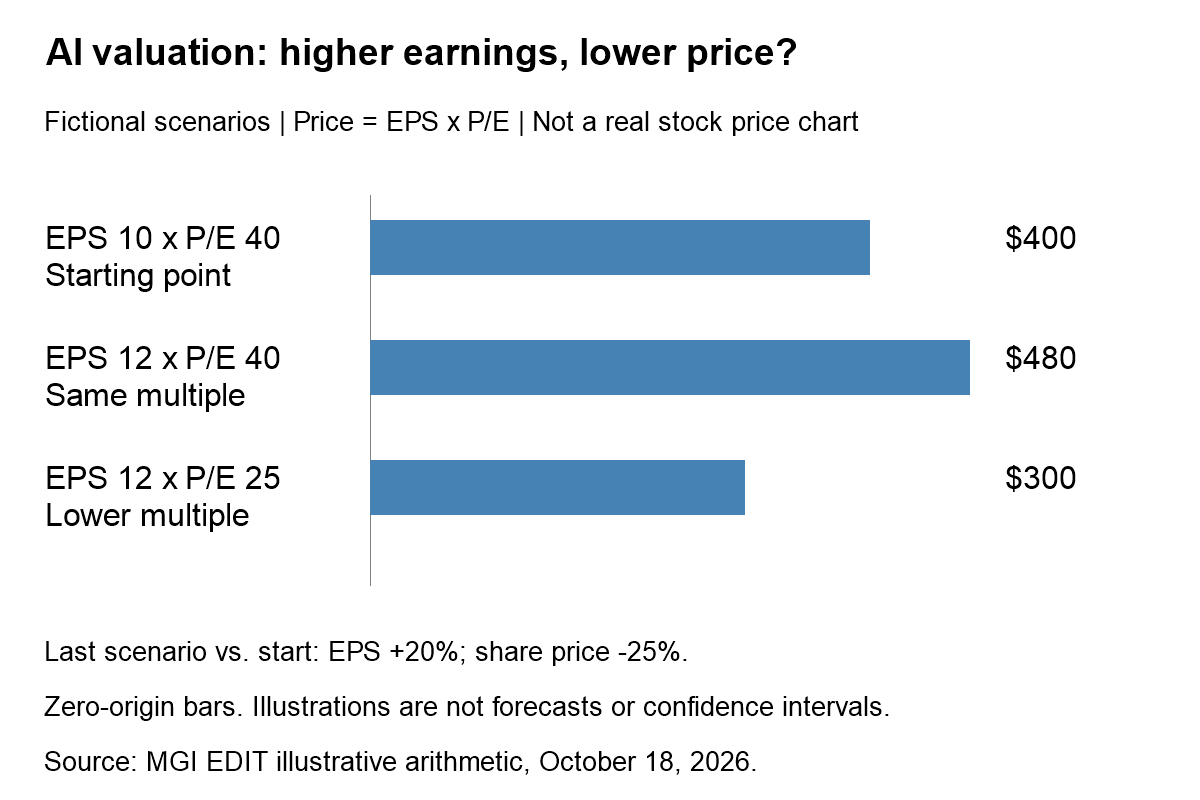
Fictional valuation scenarios: EPS 10 at P/E 40 gives $400; EPS 12 at P/E 40 gives $480; EPS 12 at P/E 25 gives $300. Not actual stock prices or a forecast.

Quick answer: Strong AI-related earnings do not guarantee rising AI stock prices. Investors pay for a stream of future profits, not just the latest quarter. A lower valuation multiple can outweigh earnings growth—even when the underlying business is expanding. Checked October 18, 2026. This weekend analysis uses company information released during the week ended October … Read more

Net Worth by Age: The New $33,000 vs. $504,900 Gap

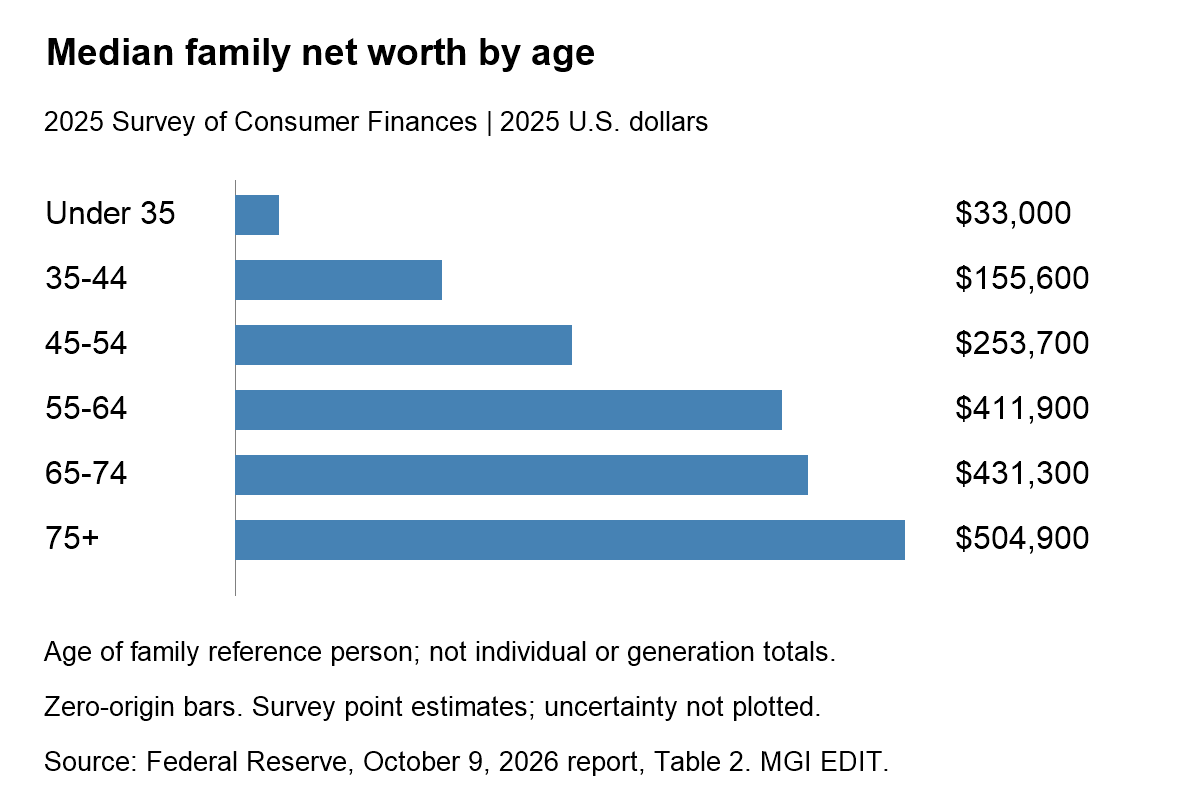
Median family net worth in the 2025 SCF: under 35 $33,000; 35–44 $155,600; 45–54 $253,700; 55–64 $411,900; 65–74 $431,300; 75+ $504,900. In 2025 dollars.

Quick answer: The Federal Reserve’s new 2025 survey puts median family net worth at $33,000 for under-35s and $504,900 for ages 75+. These are family-level estimates in 2025 dollars—not individual savings targets or live October 2026 account balances. Checked October 18, 2026. The 2025 Survey of Consumer Finances was released October 9, 2026. The publication … Read more

Retail Sales Rose 0.8%: Why the 0.2% Detail Matters

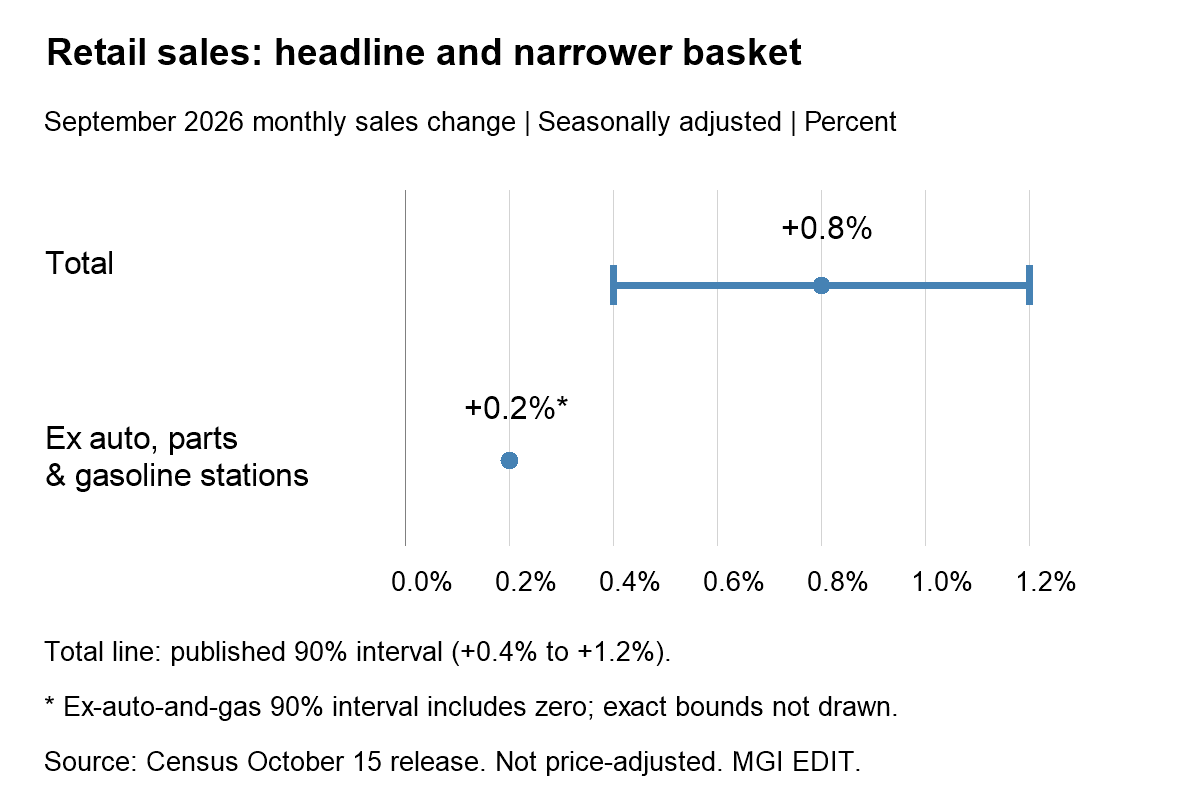
September 2026 retail sales: total up 0.8%, with a published 90% interval of 0.4% to 1.2%; excluding auto, parts and gasoline up 0.2%, whose interval includes zero.

Quick answer: September 2026 U.S. retail and food-services sales rose 0.8% month over month, but sales excluding motor-vehicle and parts dealers and gasoline stations rose 0.2%. That distinction—and the estimate’s uncertainty—matters more than treating a single headline as a verdict on every consumer business. Checked October 16, 2026. September advance estimates were released October 15 … Read more

September PPI: Why “Core” Was Both 0.7% and 0.5%

September 2026 monthly PPI: final demand 1.3%, excluding food and energy 0.7%, also excluding trade services 0.5%; different baskets, not additive.

Quick answer: September 2026 core PPI can mean either +0.7% excluding food and energy or +0.5% also excluding trade services. These are different indexes—not conflicting results. Always read the exclusions before comparing a headline with a forecast. Research checked October 16, 2026. Data: September; released October 15 at 8:30 a.m. Eastern. This is a data … Read more