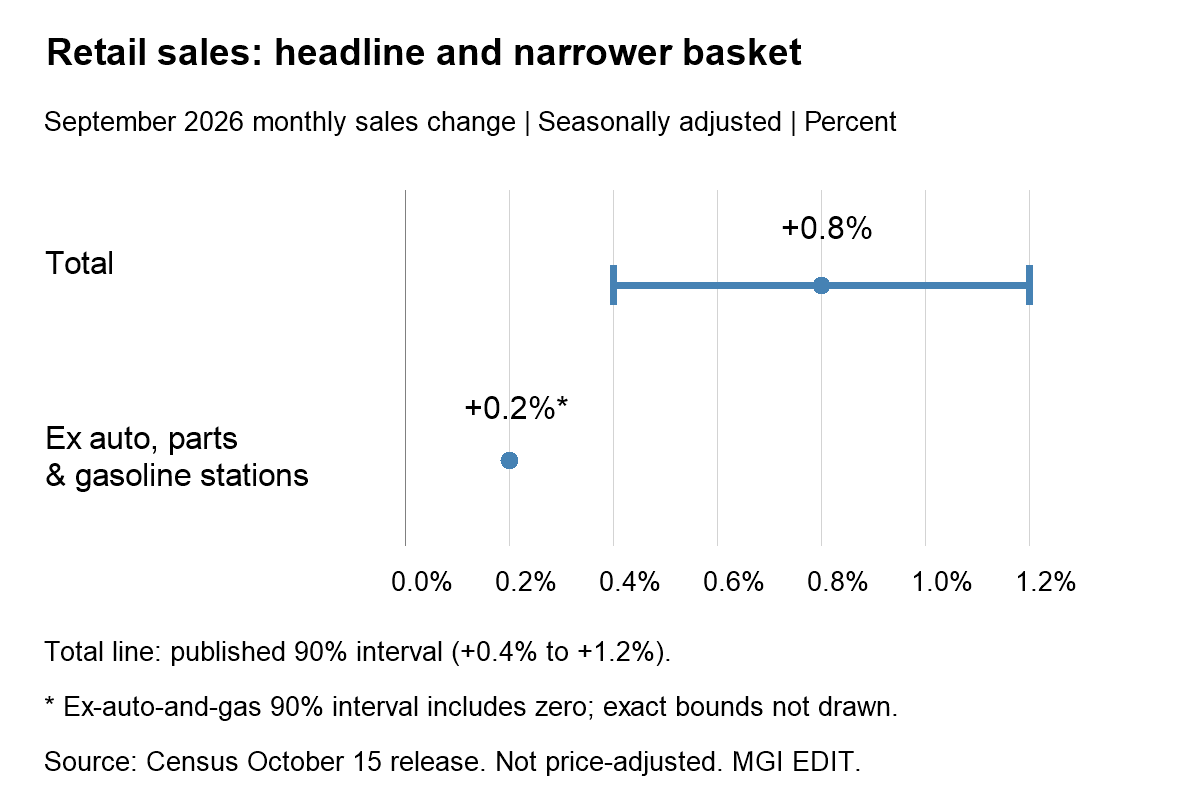
Quick answer: September 2026 U.S. retail and food-services sales rose 0.8% month over month, but sales excluding motor-vehicle and parts dealers and gasoline stations rose 0.2%. That distinction—and the estimate’s uncertainty—matters more than treating a single headline as a verdict on every consumer business.
Checked October 16, 2026. September advance estimates were released October 15 at 8:30 a.m. Eastern. This article does not report an October 16 market close.
What the September retail sales report actually measures
| Retail and food-services basket | September |
|---|---|
| Total | +0.8% |
| Excluding motor vehicles and parts | +0.9% |
| Excluding motor vehicles, parts and gasoline stations | +0.2% |
Source: Census Bureau’s October 15 release, Tables 1–2, accessed October 16. This “current” PDF is replaced with later releases. Sales are not adjusted for price changes. August’s monthly increase was revised from 1.1% to 1.3%.
The 0.2% estimate is not a precise verdict
The total’s published 90% sampling margin is ±0.4 percentage points: a range from +0.4% to +1.2%. Census marks September’s ex-auto-and-gas 0.2% estimate with an asterisk: its 90% interval includes zero. Cross-industry differences have not been tested for significance.
Our chart shows the published total interval, but does not invent exact bounds for the exclusion series. Table 3 supplies median standard errors; those are not a substitute for an exact current-month interval.
The right interpretation is uncertainty about a small change, not proof that spending in that basket fell. Nor do two separate intervals constitute a statistical test of the gap between overlapping baskets.
Higher dollar sales do not automatically mean more goods bought
Consider a fictional store: 100 identical items at $10 generate $1,000. Sell the same 100 items at $10.08 and revenue becomes $1,008—up 0.8%, with no increase in units. Alternatively, unchanged prices and more units can increase revenue. These scenarios illustrate why dollars alone cannot identify the mechanism; neither describes actual September volumes.
Do not subtract the overall CPI rate from this sales percentage and label the result “real retail growth.” Before adjusting for prices, match the products, weighting and time basis. Also avoid relabeling the ex-auto-and-gas basket as a GDP “control group” without checking the specific definition.
A better checklist for consumer stocks
- Map the company to the basket. A retailer, restaurant and vehicle dealer do not necessarily face the same demand picture.
- Separate pricing from volume. Look for transaction counts, units and comparable-sales explanations in earnings reports.
- Read costs with sales. Revenue growth is not evidence that operating profit grew at the same rate.
- Keep a revision log. Record the release date with the value rather than comparing new data with an outdated screenshot.
For context rather than a buy signal, read why confidence and spending can diverge and how oil and pump prices differ. The release does not, by itself, decide a company’s earnings outlook or the Fed’s next move.
Frequently asked questions
Did the headline prove broad consumer strength?
It showed a larger total-sales estimate, not identical growth across every business. Use the basket and uncertainty checks above.
Is 0.2% evidence of a spending collapse?
No. A small estimated change should not be turned into a confident collapse claim.
Bottom line: Read the basket, the price basis and the uncertainty together. That is more useful than choosing whichever headline sounds most bullish or bearish.
MGI EDIT analysis for general information, not personalized investment advice. Advance estimates are subject to revision.