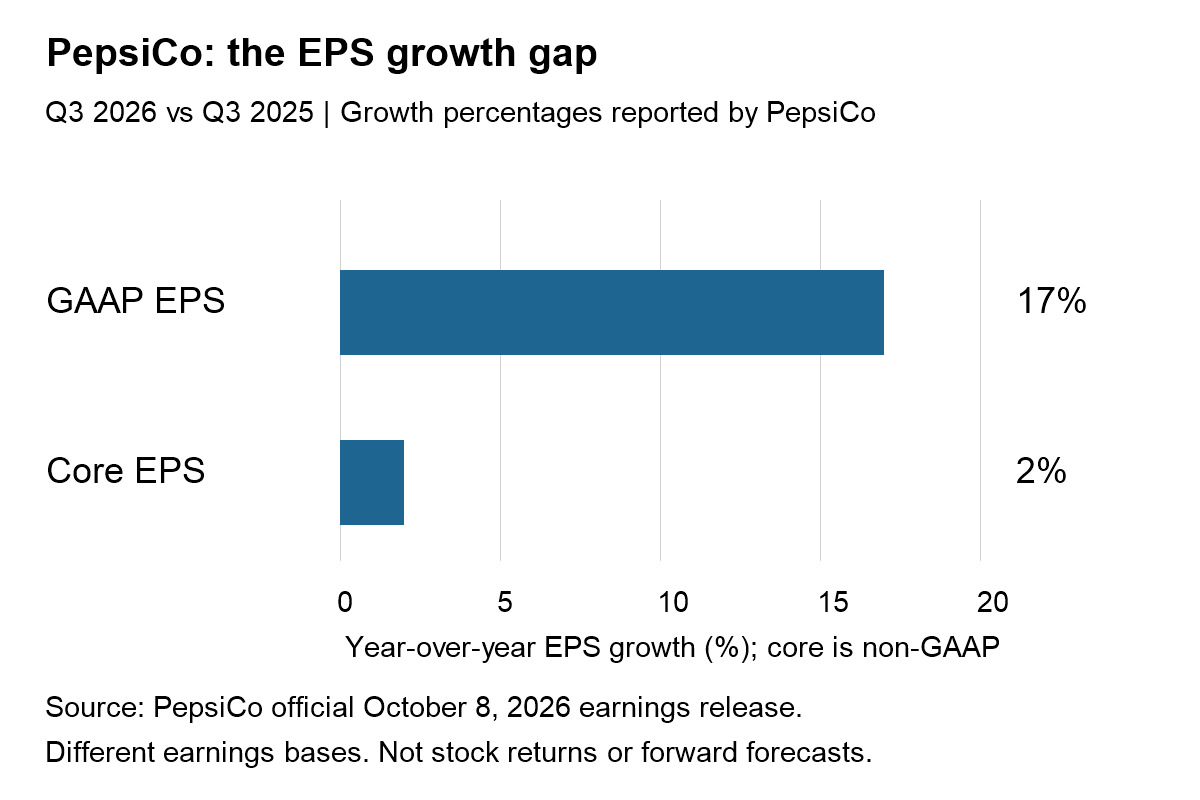
Quick answer: PepsiCo’s Q3 2026 reported earnings per share grew 17%, but core EPS grew only 2%. Both figures can be correct because they use different earnings bases. The most useful follow-up is not “Which number is fake?” but “Which adjustments changed the year-over-year comparison?”
Results checked October 9, 2026 against PepsiCo’s October 8 release, covering the 12 weeks ended September 5. Historical financial analysis, not a live PEP quote, earnings-consensus estimate or buy recommendation.
PepsiCo earnings: the two EPS comparisons
The official Q3 release reports GAAP EPS of $2.23 versus $1.90 a year earlier, and core EPS of $2.34 versus $2.29. The SEC-filed quarterly report independently provides the reported EPS comparison and a GAAP-to-core reconciliation. Core measures are non-GAAP. This is an actual-results follow-up to our dated pre-release consumer checklist, not another event preview.
| Measure | Q3 2025 | Q3 2026 | Reported growth |
|---|---|---|---|
| GAAP EPS | $1.90 | $2.23 | 17% |
| Core EPS, non-GAAP | $2.29 | $2.34 | 2% |
MGI calculation: The displayed-dollar increase is $0.33 for GAAP EPS but $0.05 for core EPS. These are separate changes from separate baselines, not two estimates of the same underlying increment. Calculating growth from rounded EPS will not exactly reproduce a percentage based on the company’s unrounded records.
The adjustment gap shrank on both sides of the comparison
Subtracting displayed GAAP EPS from displayed core EPS gives $0.39 for the prior-year quarter and $0.11 for the current quarter. The $0.28 narrowing helps explain why reported growth can outpace core growth. It does not by itself identify every excluded item, quantify tax effects or prove that all adjustments were one-time.
The SEC reconciliation makes the comparison concrete: the acquisition/divestiture adjustment moved from +$0.12 to −$0.05 per share, while the pension/retiree adjustment moved from +$0.01 to +$0.10. These moved in opposite directions. They are selected reconciliation items, not a complete bridge; the filing explicitly warns that displayed amounts may not sum because of rounding.
MGI interpretation: Always compare the reconciliation in both periods. An adjustment that made last year’s reported earnings smaller can lift this year’s reported growth even when underlying progress is more modest. Looking only at the current quarter’s excluded charges misses half the comparison.
Profit dollars can rise while a margin falls
PepsiCo reports core operating profit growth of 3%, while core operating margin declined 35 basis points. Its displayed margins are 16.9% versus 17.3%; the stated basis-point change uses unrounded data. The rounded table therefore should not be used to replace the company’s 35-basis-point figure with an asserted exact 40-basis-point decline.
Here is a separate, purely hypothetical example. A company with revenue of $100 and operating profit of $17 has a 17% margin. If revenue rises to $110 and profit to $18, profit dollars rise about 5.9%, but margin falls to about 16.4%. Neither of those invented companies is PepsiCo; the example isolates the denominator effect.
| Input | Before | After |
|---|---|---|
| Revenue | $100 | $110 |
| Operating profit | $17 | $18 |
| Operating margin | 17.0% | 16.4%, rounded |
A five-line earnings-quality worksheet
- Same period: Record the fiscal dates, not just the release month.
- Same accounting basis: Put reported EPS next to reported EPS and core next to core.
- Both reconciliations: Identify which exclusions changed between the two quarters.
- Margin denominator: Compare profit dollars with revenue, not EPS alone.
- Cash and durability: Ask whether improved accounting results are accompanied by cash generation and sustainable operations.
This worksheet is a starting point for reading the release, not a valuation model. It contains no assumed fair-value multiple, future EPS forecast or stock-price target. A share-price reaction can reflect expectations about future results rather than a simple ranking of the quarter’s percentage changes.
Our APLD reporting-basis analysis illustrates the same habit in another industry: separate recurring activity, reporting scope and adjusted measures before extrapolating a growth headline.
Frequently asked questions
Is core EPS the same as GAAP EPS?
No. Core is the company’s adjusted non-GAAP measure; consult its definitions and reconciliation instead of treating it as interchangeable with reported EPS.
Does slower core growth make the stock a sell?
No. This comparison alone cannot decide a trade. Valuation, expectations, future cash flows and personal circumstances are separate questions.
Source note: company observations come from the official release; subtraction and the small margin example are MGI calculations. The chart displays reported growth, not a price return or forecast. General financial education, not personalized investment advice.