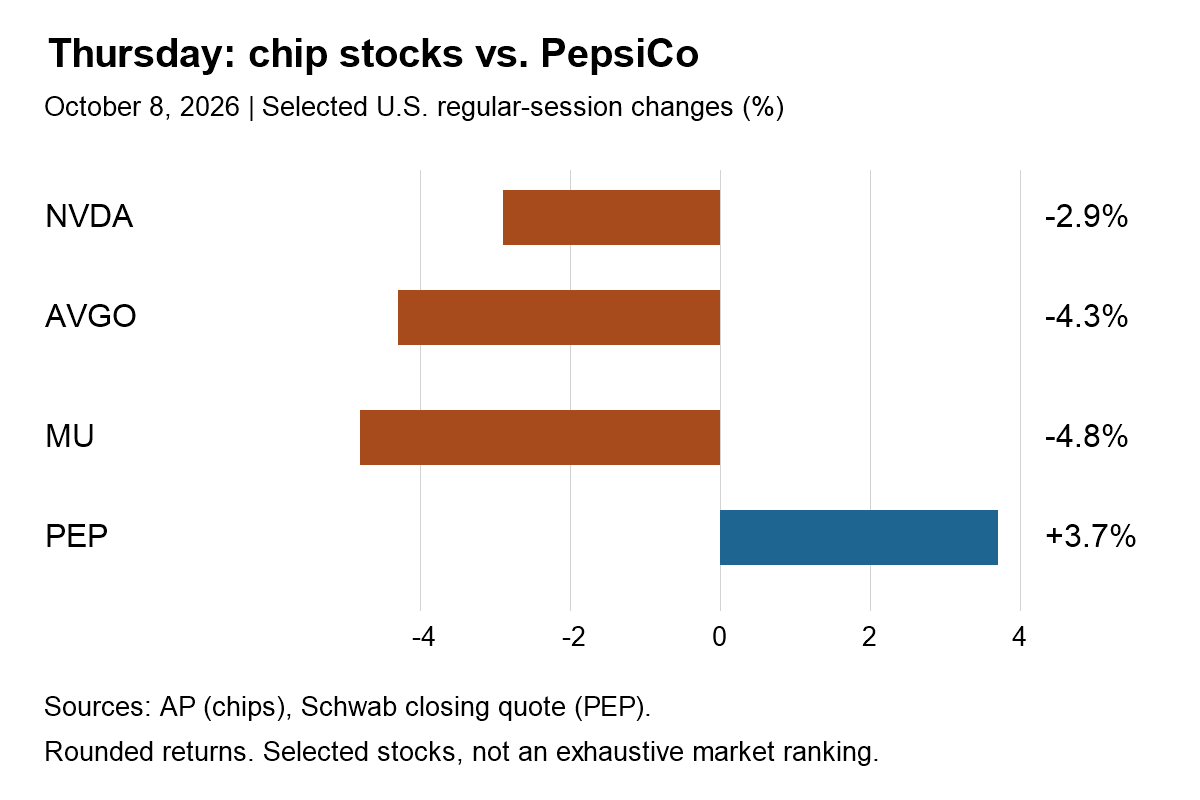
Quick answer: Thursday’s chip-stock selloff was not a uniform market collapse. The Nasdaq fell while the Dow edged higher. The useful question is whether a portfolio’s weakness reflects concentrated exposure to large technology stocks, rather than assuming every company faced the same pressure.
Historical review of the October 8, 2026 U.S. regular session; checked October 9. Not live prices, an exhaustive movers ranking or personalized investment advice.
October 8 stock market: the closing picture
| Index | Close | Daily change |
|---|---|---|
| S&P 500 | 7,765.36 | −0.5% |
| Dow Jones Industrial Average | 51,231.64 | +0.1% |
| Nasdaq Composite | 27,193.34 | −1.3% |
| Russell 2000 | 2,794.13 | Positive, less than 0.1% |
Source: AP’s October 8 closing-index report. The Russell’s small increase should not be rounded into a claim that it declined or was exactly unchanged.
NVDA, AVGO and MU fell; PEP moved the other way
| Company | Ticker | Daily change |
|---|---|---|
| Nvidia | NVDA | −2.9% |
| Broadcom | AVGO | −4.3% |
| Micron | MU | −4.8% |
| PepsiCo | PEP | +3.7% |
Chip returns are from the AP Thursday recap. PEP’s Schwab closing quote reported $128.34 and +3.73% at 4:00 p.m. Eastern; the table rounds that return to one decimal. Do not mix those closing observations with premarket estimates.
Why a falling index can coexist with rising stocks
AP reported that about two-thirds of S&P 500 constituents rose. Counting winners and weighting their market values answer different questions: participation versus index return.
MGI illustrative calculation: imagine one stock has a 10% index weight and falls 3%, while the other stocks, with a combined 90% weight, rise 0.2%. Their approximate contributions are −0.30 and +0.18 percentage points, giving a net −0.12%. Most stocks can rise while the weighted index falls.
These are hypothetical weights and moves, not an attribution model for Thursday. They explain the mechanism without inventing the exact contribution of any actual constituent. An equal-weight comparison, an advance–decline count and a capitalization-weighted benchmark should not be described as interchangeable indicators.
Strong semiconductor sales do not guarantee a green share price
TSMC’s official September revenue release, issued October 8, reported NT$511.86 billion of consolidated sales: up 54.6% year over year but down 0.6% from August. The two comparisons describe different baselines. This monthly report is not a full quarterly profit or margin disclosure.
MGI interpretation: business growth and investment returns are separate tests. A higher sales number may already be anticipated in a share price; a company can also sell more while its cost of production or future investment requirement increases. None of those possibilities establishes the exact cause of a daily stock move.
For a purely hypothetical valuation illustration, earnings increasing 10% while the price-to-earnings multiple falls 15% implies 1.10 × 0.85 = 0.935, or a 6.5% lower price. It is a simplified identity, not a prediction for any chipmaker.
Read earnings and price reactions on separate lines
PepsiCo’s official event notice scheduled the quarter ending September 5 for an October 8 release. That fiscal reference period is different from a calendar-quarter convention. A rising share price alone does not verify volume growth, margin improvement or the durability of guidance.
Use our PepsiCo consumer-demand checklist as a dated pre-release framework, and our TSMC margin checklist for the distinction between revenue and profitability.
Five checks before chasing the next rebound
- Match each price move to its session and timestamp.
- Separate a market-wide decline from concentrated portfolio exposure.
- Read reported results separately from expectations and forecasts.
- Check cash flow and costs before equating sales growth with earnings quality.
- Ask what evidence would invalidate the thesis; do not turn one rebound into a guaranteed trend.
The Tuesday–Wednesday market comparison provides the preceding sessions’ context.
Frequently asked questions
Was Thursday’s Nasdaq decline proof that all U.S. stocks fell?
No. Benchmark weights and the number of advancing stocks measure different things.
Does this chart show intraday prices or technical support levels?
No. It compares selected rounded daily returns. No candles, price targets or trading levels are fabricated.
MGI separates verified observations, hypothetical arithmetic and interpretation. Historical numbers are not current quotes or recommendations to buy or sell.