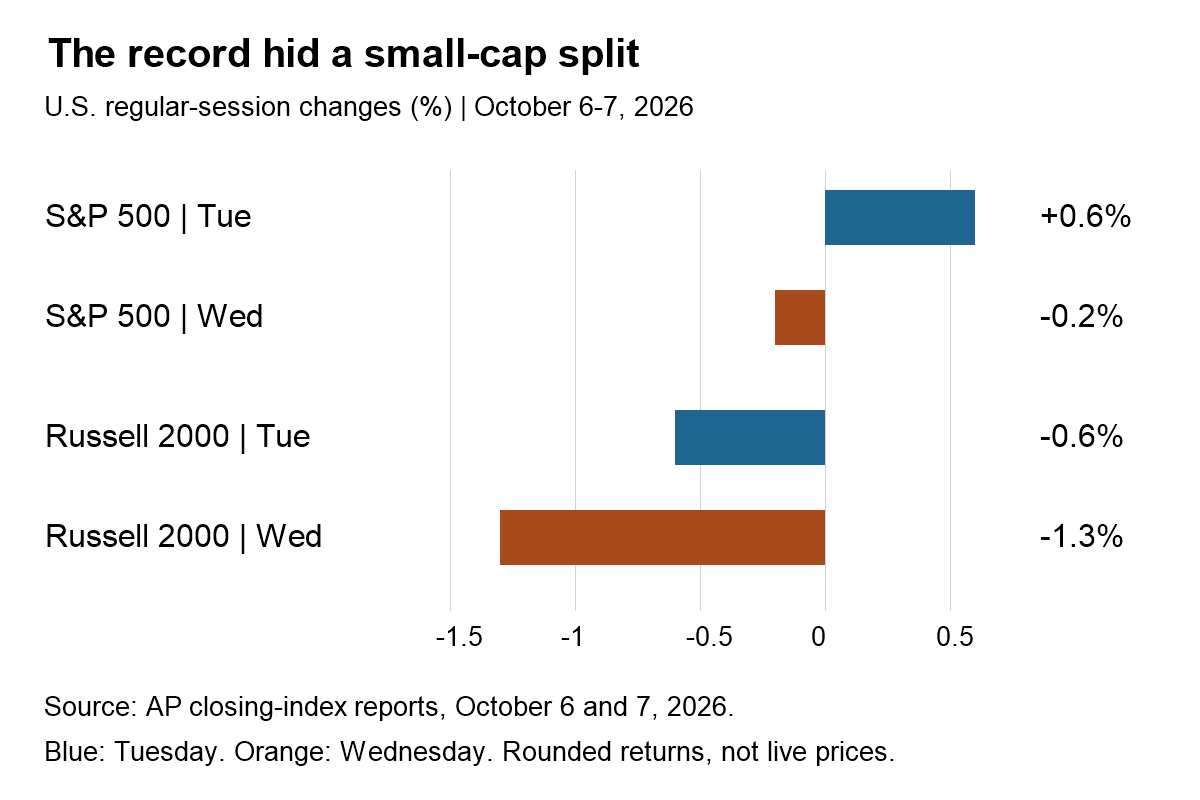
Quick answer: Tuesday’s record-high S&P 500 did not mean every part of the U.S. market was strong. Small caps fell on October 6 and lost more ground on October 7. The useful lesson from these two sessions is to separate a company-specific catalyst from index performance—and an intraday interest-rate spike from the closing level.
Historical review of the October 6–7, 2026 U.S. regular sessions. Evidence checked October 8. Figures are not live quotes, forecasts or an exhaustive list of gainers.
Tuesday versus Wednesday: the index split
| Index | Tuesday, October 6 | Wednesday, October 7 |
|---|---|---|
| S&P 500 | +0.6% | −0.2% |
| Dow Jones Industrial Average | +0.5% | −0.7% |
| Nasdaq Composite | +0.4% | −0.2% |
| Russell 2000 | −0.6% | −1.3% |
Sources: AP’s October 6 closing-index report and October 7 closing-index report. Tuesday brought fresh S&P 500 and Nasdaq records; Wednesday reversed part of those gains.
MGI calculation: compounding the rounded daily changes gives approximately +0.40% for the S&P 500 over the two sessions, versus −1.89% for the Russell 2000. The corresponding gap is about 2.29 percentage points. This approximation is not the exact return calculated from unrounded closing levels.
The formula is (1 + Tuesday return) × (1 + Wednesday return) − 1. Adding two daily percentages is only an approximation. The contrast tells us that the small-cap benchmark lagged; it does not tell us how many individual companies advanced, nor prove a recession is imminent.
Tuesday’s leaders: three different reasons to rally
The AP Tuesday market recap reported Constellation Energy (CEG) up 12.2%, Lamb Weston (LW) up 7.5%, and Option Care Health (OPCH) up 32.6%. Their catalysts differed: a power agreement, earnings, and a proposed acquisition respectively. These are selected movers, not a verified ranking of the day’s largest gains.
CEG’s official announcement with Google describes 890 MW of incremental nuclear capacity supported by a 20-year power agreement. It separately describes a 2,700 MW, 15-year supply agreement for existing generation. The first uprate is expected by 2028. Proposed future capacity is not electricity already delivered today.
MGI interpretation: these categories should not share the same checklist. A power deal needs construction, funding and delivery scrutiny. An earnings rally needs a check on the repeatability of operating performance. A takeover rally needs consideration terms, approvals and failure-risk analysis. A similar-looking green candle can conceal a very different economic proposition.
For the acquisition framework, see our Monday PTC–RXO takeover-rally analysis.
Wednesday: a rate scare was not the same as a closing-yield surge
The AP Wednesday recap reported the 10-year Treasury yield reaching 5.36% in the morning before easing to 5.28% later. Worthington Steel (WS) fell 6.9%, while Constellation Brands (STZ) gained 2.4%. Do not confuse STZ, the beverages company, with CEG, the power producer.
MGI interpretation: the intraday high shows the pressure investors faced during the session. The later level shows why “yields surged” is an incomplete description of the whole day. An explanation should specify the timestamp and distinguish a bond-yield percentage from a bond-price return.
Nor does one day identify a single cause for every stock’s move. Earnings, valuation expectations, liquidity and company-specific news can matter alongside rates. A market recap is evidence of reported conditions, not a controlled experiment establishing how much each factor contributed.
A five-step checklist before chasing a two-day leader
- Fix the session: distinguish the regular close from premarket and after-hours trading.
- Classify the catalyst: earnings, contract, takeover, analyst commentary or general market movement.
- Read the original terms: separate future commitments from realized cash flow.
- Check participation: compare multiple benchmarks rather than using one record high as proof of broad strength.
- Define failure conditions: identify what could invalidate the business thesis without inventing a target price.
Our APLD recurring-rent versus fit-out analysis shows why an AI-infrastructure revenue headline also needs a closer accounting check.
Frequently asked questions
Did Wednesday erase all of Tuesday’s S&P 500 gain?
No. The compounded rounded-return calculation remains positive across these two sessions.
Does Russell 2000 weakness prove a recession?
No. It is a benchmark-performance observation, not a recession diagnosis or an advance–decline count.
Educational market commentary, not personalized investment advice. Chart uses reported rounded daily returns; no fabricated price history or technical buy signals.