Quick answer: Gold does not have to rise after a hotter CPI report. The useful question is whether inflation news changes expected real interest rates, the dollar and demand for protection—not simply whether consumer prices increased.
Research checked October 12, 2026. This is a pre-release explanation, not a September CPI result or a live gold-price feed.
Why is gold in focus before the October 14 CPI report?
Reuters reported on October 12 that spot gold was down 0.2% at $4,185.13 an ounce at 07:14 GMT as investors awaited U.S. inflation data. That is a timestamped intraday observation, not Monday’s close. Earlier prices can differ without either observation being wrong. Reuters market report.
The Bureau of Labor Statistics schedules September CPI for October 14 at 8:30 a.m. Eastern Time. Until that release, a forecast is not an official reading. Avoid treating a calendar preview, analyst estimate or social-media number as the published result.
How can inflation rise while gold falls?
A Chicago Fed study published in November 2021 examines inflation expectations, expected long-term real rates and concern about economic conditions. Its evidence supports considering these channels together; historical correlations do not establish a guaranteed daily trading rule.
Gold provides no coupon. Higher expected real returns on interest-paying alternatives can increase its opportunity cost, other things equal. But safe-haven demand or currency moves can push the other way. One CPI headline cannot identify which force dominated a particular trade.
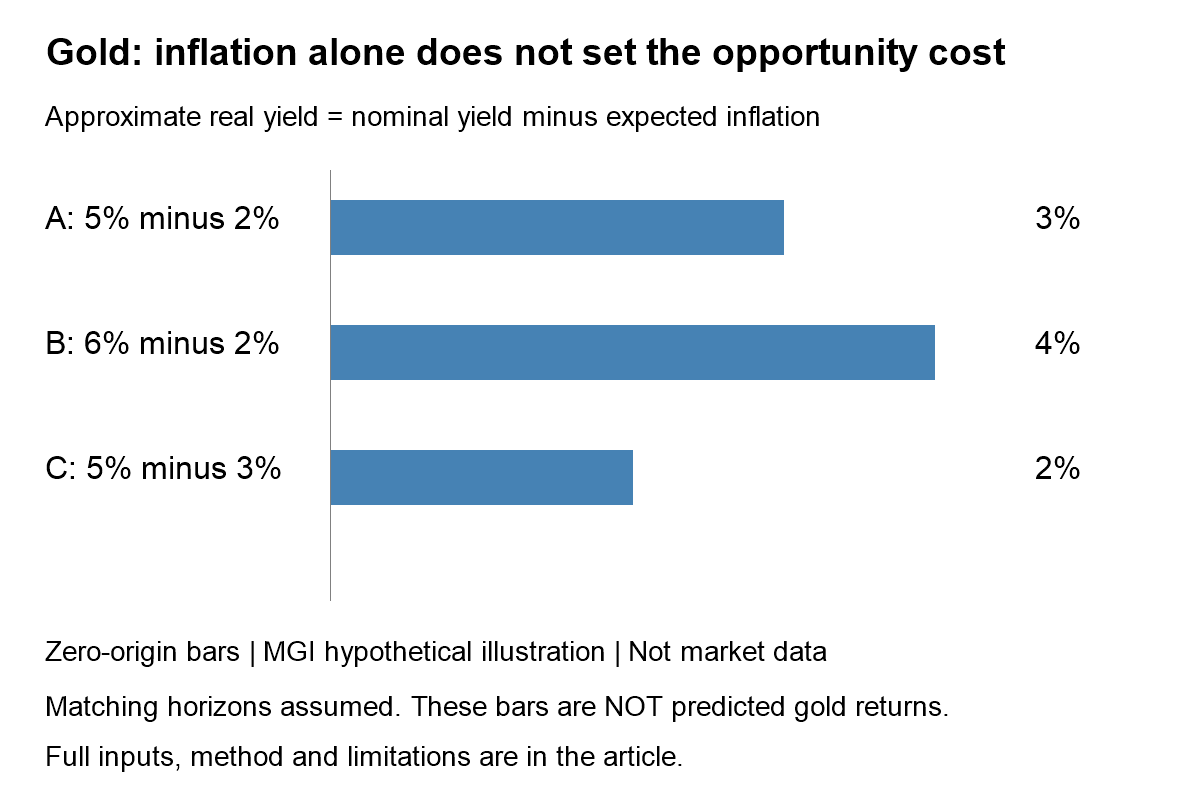
A simple real-rate example—not a gold forecast
For a teaching approximation, subtract expected inflation from the nominal yield over a matching horizon. Do not subtract last month’s annual CPI from a ten-year yield and call the result the market’s expected ten-year real yield.
| Scenario | Nominal yield | Expected inflation | Approximate real yield |
|---|---|---|---|
| A | 5.0% | 2.0% | 3.0% |
| B | 6.0% | 2.0% | 4.0% |
| C | 5.0% | 3.0% | 2.0% |
B raises the opportunity-cost proxy by one percentage point; C lowers it by one point. Neither calculation supplies a gold return, price target or probability. For the exact hypothetical Fisher calculation, (1 + nominal rate)/(1 + expected inflation) − 1 gives approximately 2.94%, 3.92% and 1.94%. The chart uses the simpler subtraction so the mechanism remains transparent.
Four checks before interpreting gold’s CPI reaction
- Read the surprise, not just the level. Compare the official result with a clearly identified, timestamped expectation. Without a verified consensus, describe the change without calling it a beat or miss.
- Match the clock. Compare gold, yields and the dollar over the same interval. A morning quote and a closing yield do not describe one synchronized reaction.
- Separate the asset. Spot gold, futures, a gold fund and a mining stock have different exposures. A miner also has operating costs and business risks.
- Allow competing explanations. A price move consistent with higher real rates is not proof that rates alone caused it. Identify what evidence would contradict the explanation.
For the policy side, see our Fed hike-versus-pause explanation. For the household side, compare consumer sentiment and expectations; those survey measures are not a gold valuation model.
Frequently asked questions
Is gold an automatic inflation hedge?
No. A long-run inflation-protection argument does not guarantee a positive return after every CPI release.
Does lower CPI guarantee higher gold?
No. What was already priced in, interest-rate expectations, currency changes and risk demand can alter the response.
Bottom line: Read gold’s inflation story through expectations and opportunity cost, then test it against synchronized evidence. This educational article is not individualized investment advice.