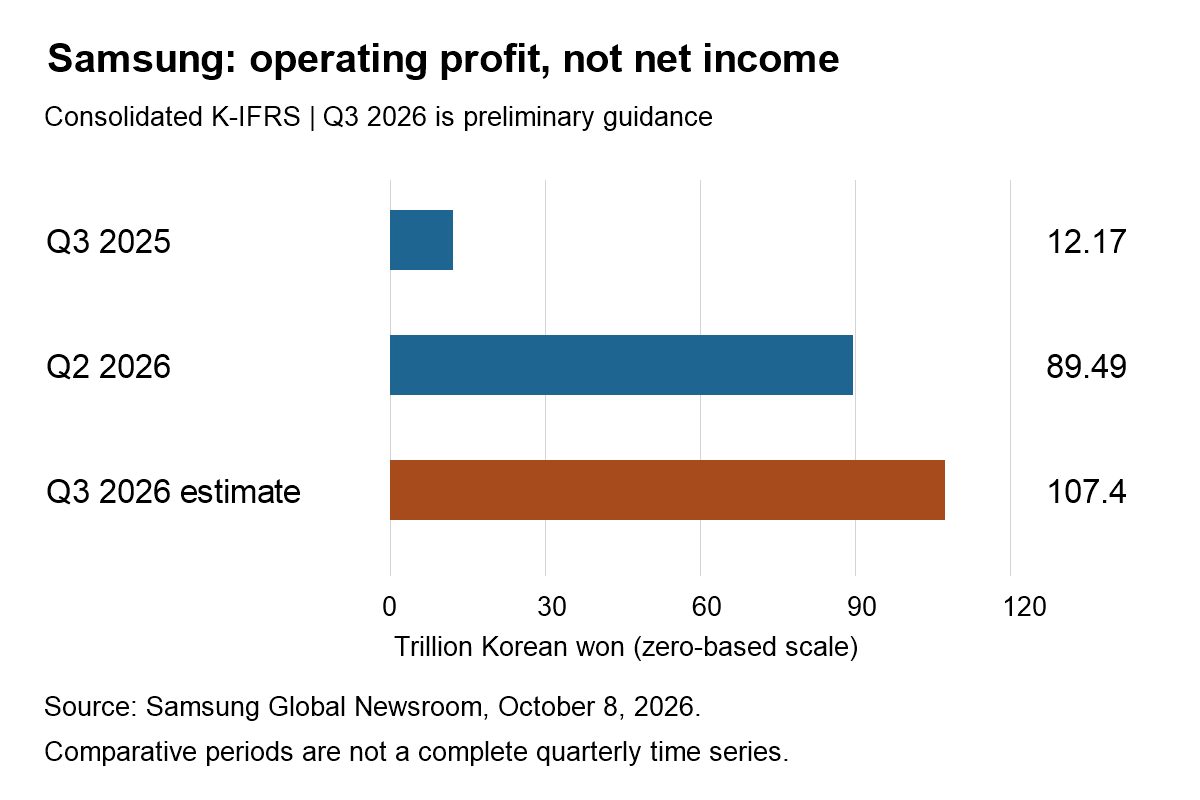
Quick answer: Samsung Electronics’ October 8 preliminary guidance points to a much larger operating profit, but it does not establish how much profit came from AI memory or how much cash shareholders can ultimately receive. Read the consolidated figures first, then wait for segment results and cash-flow details before treating the headline as a complete investment case.
Evidence checked October 8, 2026. Q3 2026 figures below are company estimates, not finalized earnings, live stock prices, or a price target.
Samsung Q3 2026 guidance: the numbers that matter
The official Samsung release estimates consolidated sales of KRW 195 trillion and operating profit of KRW 107.40 trillion. Its comparison periods use K-IFRS, making them a cleaner starting point than dollar conversions made at different exchange rates.
| Period | Sales | Operating profit |
|---|---|---|
| Q3 2025 | 86.06 | 12.17 |
| Q2 2026 | 171.5 | 89.49 |
| Q3 2026 preliminary | 195 | 107.40 |
The company describes the Q3 headline figures as medians of estimate ranges: sales of KRW 194–196 trillion and operating profit of KRW 107.3–107.5 trillion. These are consolidated estimates, not semiconductor-only results.
The more useful comparison: margin, not just profit growth
MGI calculation: operating profit divided by sales gives an implied Q3 margin of approximately 55.1%, compared with 52.2% in Q2 and 14.1% in the year-earlier quarter. The sequential improvement is about 2.9 percentage points. All calculations use the rounded company figures; they are not reported segment margins.
That distinction changes the question a reader should ask. A dramatic annual growth rate can partly reflect a smaller comparison base. Sequential margin improvement tests whether the newer quarter is stronger even after comparing it with an already profitable quarter. Neither test explains the business mix on its own.
What this guidance cannot tell you about AI memory
Do not read an aggregate margin as the return on one product. Imagine a hypothetical manufacturer with two divisions: one selling more units at unchanged prices, the other selling fewer units at much higher prices. Its total profit could rise in both cases, while the persistence of that improvement would differ materially.
For the same reason, an AI investment narrative needs evidence of repeat demand, production execution, and the cost of maintaining capacity. A good question is not simply “Did profit rise?” but “What must stay true for this level of earnings to continue?” The October guidance alone does not answer that.
Five checks for the detailed earnings report
- Segment bridge: identify which businesses produced the change.
- Price versus volume: distinguish a richer selling price from more shipments.
- Product mix: check whether higher-value products improve the blended result.
- Cash conversion: compare earnings with operating cash flow and working-capital needs.
- Capacity economics: weigh future investment against incremental earnings, rather than counting spending itself as a benefit.
Use the official investor-relations events page for follow-up material. No unverified final-report date or HBM-specific margin is assumed here.
Why a strong report does not guarantee a rising stock
A share price reflects the comparison between future expectations and the price already paid. In a purely illustrative example, earnings increasing 20% while a valuation multiple falls 25% would leave their product down 10%: 1.20 × 0.75 = 0.90. This is arithmetic, not a forecast for Samsung.
For related context, see our TSMC AI growth and margin checklist and guide to separating stock-move headlines from underlying economics.
Frequently asked questions
Is KRW 107.40 trillion Samsung’s net income?
No. It is preliminary consolidated operating profit. Net income is a different measure.
Does the guidance disclose an HBM profit margin?
No. A company-wide calculation cannot substitute for a product-level disclosure.
Educational market analysis, not personalized investment advice. Chart: MGI rendering of the official figures; no generated stock-price path.