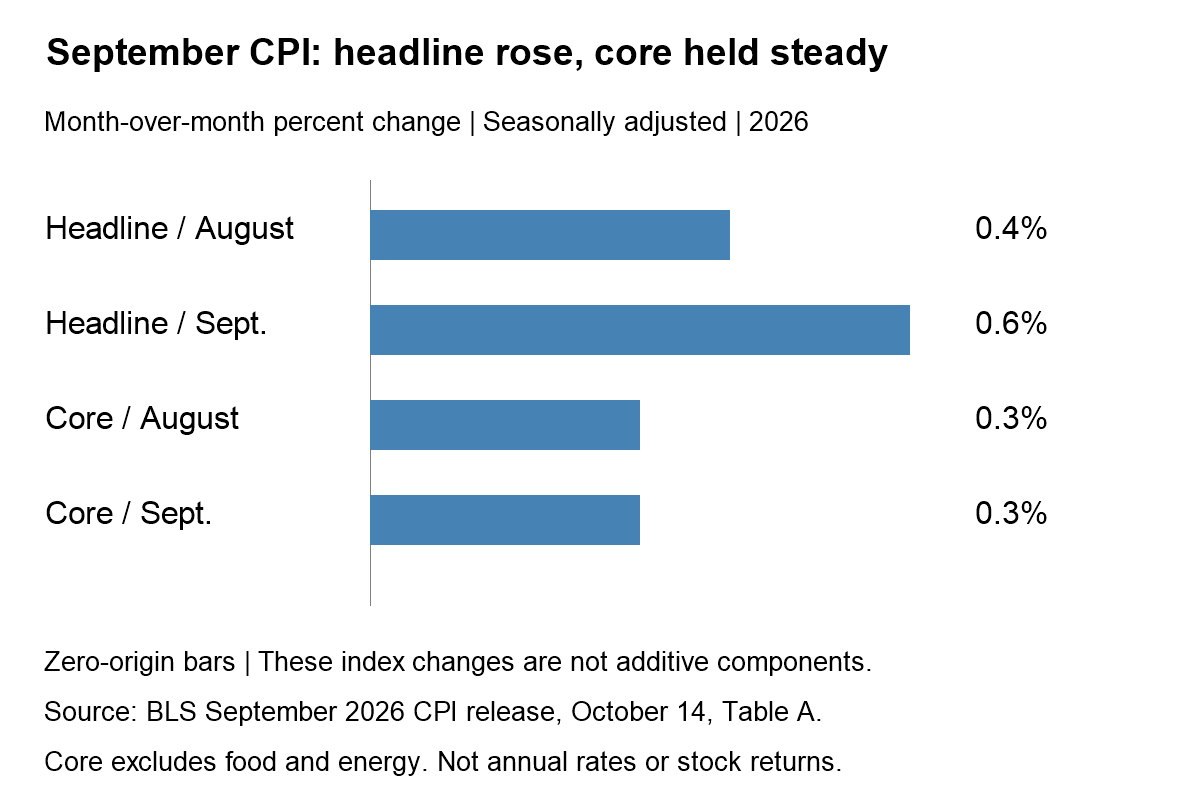
Quick answer: September 2026 CPI rose 0.6% over the month and 3.7% over the year. Gasoline accounted for more than half of the monthly headline increase, according to BLS. But core CPI still rose 0.3% monthly and 2.6% annually. “Energy-driven” does not mean there was no underlying price pressure.
Prepared October 16, 2026, from official data verified October 15. The data below were released October 14 at 8:30 a.m. Eastern Time. This is a report breakdown, not a live U.S. market recap.
What did the September CPI report actually show?
The official BLS release shows headline monthly inflation accelerating from 0.4% in August to 0.6% in September. Core monthly inflation, which excludes food and energy, stayed at 0.3%. Monthly figures here are seasonally adjusted; annual figures are unadjusted 12-month changes.
| Measure | August | September |
|---|---|---|
| Headline, monthly, seasonally adjusted | 0.4% | 0.6% |
| Core, monthly, seasonally adjusted | 0.3% | 0.3% |
| Headline, annual, unadjusted | 3.4% | 3.7% |
| Core, annual, unadjusted | 2.4% | 2.6% |
Why was gasoline so important?
BLS reported a 9.1% seasonally adjusted monthly increase in gasoline and explicitly attributed over half of the monthly all-items rise to it. Energy as a whole rose 5.2%. These are category growth rates, not additive contributions that can be summed with headline CPI.
A common mistake is to subtract 9.1% from 0.6% and call the result “inflation without gasoline.” That combines the change in one category with the change in a weighted basket. The category’s weight and the index methodology matter. This article uses BLS’s contribution description instead of inventing an ex-gasoline index.
Likewise, subtracting annual core CPI from annual headline CPI gives a difference between two index-growth rates, not a clean numerical estimate of energy’s annual contribution. Food is excluded from core as well, and each index has its own composition.
How can core monthly inflation hold steady while annual core rises?
A monthly reading compares nearby months; a 12-month reading compares a different pair of index levels. The annual rate also changes when an old month leaves the comparison window. There is no contradiction in a rounded monthly rate staying at 0.3% while the annual rate rises from 2.4% to 2.6%.
MGI arithmetic example: if a price index starts at 100, a 0.3% monthly rise takes it to 100.3. Repeating exactly that rate for 12 months would give 100 × 1.00312 ≈ 103.66, or about 3.66% growth. That is a hypothetical constant-rate path—not the reported 2.6% annual core figure and not a forecast.
What does this mean for stocks and the Fed?
A price report can change expectations about future cash flows, financing costs and the discount rate applied to earnings. But the report does not itself establish a stock-market return, a Treasury closing yield or a guaranteed policy response. Avoid treating the inflation reading as a complete trading instruction.
For an event study, compare market prices immediately before the release with a clearly defined later timestamp, then identify concurrent news. A premarket quote, intraday high and closing observation answer different questions. Without a verified consensus, this article does not label the figures a numerical “beat” or “miss.”
For the rate channel, see why bond prices fall when interest rates rise. For a different price pipeline, compare PPI versus CPI and why producer costs do not pass through automatically.
A four-step reading checklist
- Read monthly and annual rates separately; do not mix their units.
- Check whether a large category move is also a large weighted contribution.
- Compare the level, the change and any verified expectation as separate facts.
- Keep released data apart from forecasts about rates, earnings or asset prices.
Frequently asked questions
Was September CPI entirely an energy story?
No. Gasoline drove over half of the monthly headline increase, but core CPI also increased.
Does unchanged 0.3% monthly core inflation mean prices stopped rising?
No. It means the reported monthly percentage increase was unchanged, not that the price level was flat.
Does this CPI report guarantee a Fed rate hike?
No. A policy forecast requires more evidence than one inflation release.
Bottom line: Energy explains much of the headline acceleration, while core, time horizons and expectations still matter. This is educational market analysis, not personalized investment advice.