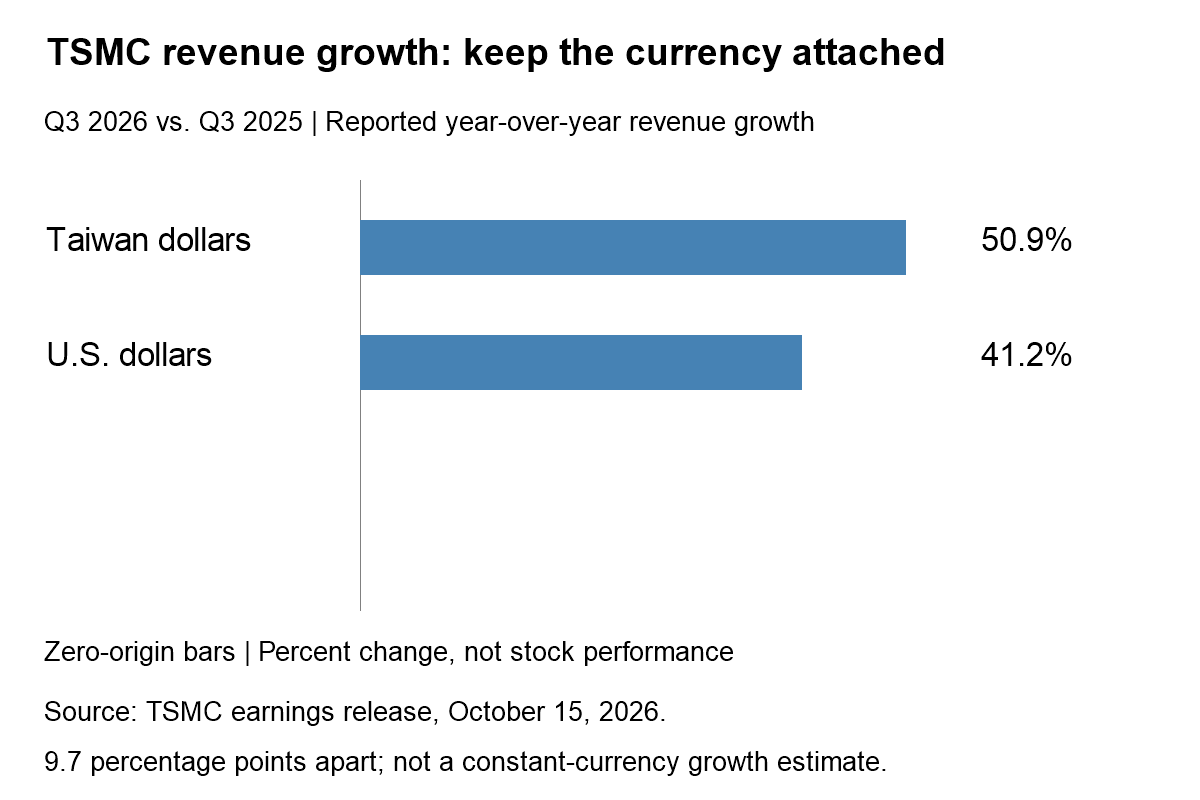
Quick answer: TSMC’s Q3 2026 revenue grew 50.9% in Taiwan dollars and 41.2% in U.S. dollars. Both describe the same business in different reporting currencies—not two competing estimates. The gap matters when comparing the earnings headline with dollar-denominated guidance or a U.S.-listed investment.
Research checked October 15, 2026. These are released quarterly results, not a live stock quote or a claim about today’s closing price.
What did TSMC report on October 15?
For the quarter ended September 30, TSMC reported revenue of NT$1,494.24 billion, equivalent to US$46.72 billion. Diluted EPS was NT$29.43, or US$4.60 per ADR unit. Gross margin was 66.4%. The company’s October 15 earnings release supplies these figures and the currency-specific growth rates.
| Measure | Taiwan-dollar reporting | U.S.-dollar reporting |
|---|---|---|
| Revenue | NT$1,494.24 billion | US$46.72 billion |
| Year-over-year growth | 50.9% | 41.2% |
| Quarter-over-quarter growth | 17.6% | 16.2% |
Why are 50.9% and 41.2% both correct?
A growth rate compares a current amount with a prior amount measured on the same basis. Translating both periods into another currency can change that comparison. Do not attach the Taiwan-dollar growth rate to the U.S.-dollar revenue figure and present the pair as one consistent series.
MGI calculation: 50.9 minus 41.2 equals a 9.7-percentage-point gap. It is not 9.7% additional sales, a stock return, or proof that exchange rates created that much operating value. The release does not turn this subtraction into a constant-currency growth measure.
A simple comparison shows why the denominator matters. With a separate index of 100 for each currency’s year-earlier revenue, the current readings would be 150.9 and 141.2. Those are normalized teaching indices, not revenue totals that can be added together. The chart compares the actual reported growth percentages instead.
Does Q4 guidance imply another growth step?
Management guided Q4 revenue to US$52.3 billion–US$54.3 billion. This is an outlook, not booked revenue. Compared with Q3’s US$46.72 billion, the endpoints imply approximately 11.9%–16.2% sequential growth; the US$53.3 billion midpoint implies about 14.1%. These are MGI calculations: (guidance / 46.72 − 1) × 100.
That arithmetic is deliberately dollar-to-dollar. Comparing a dollar forecast with Taiwan-dollar revenue would mix units. The midpoint is a convenient summary of the range, not a probability-weighted forecast or a management promise.
Four checks before turning strong earnings into a stock thesis
- Choose the right baseline. Annual growth answers a different question from sequential growth. Do not compare one with the other as if momentum accelerated by their difference.
- Separate margin from growth. A high gross margin describes production economics before other expenses; it is not the shareholder’s return.
- Keep security units straight. NT-dollar EPS per ordinary share and U.S.-dollar earnings per ADR unit are not interchangeable price denominators.
- Ask what was priced in. A strong reported result alone cannot establish an earnings surprise or explain a share-price move without a verified expectation and synchronized market data.
For the original pre-release questions, see our TSMC AI-demand and margin preview; it is a preview, not this results analysis. For another example of why headline sales need definition checks, read the APLD revenue-versus-base-rent breakdown.
Frequently asked questions
Did TSMC revenue grow 50.9% or 41.2%?
Both: 50.9% year over year in Taiwan dollars and 41.2% in U.S. dollars. State the currency every time.
Does the 9.7-point gap measure a stock gain?
No. It is the difference between two reported revenue-growth percentages, not an investment return.
Is the Q4 midpoint guaranteed?
No. It is the arithmetic center of management’s revenue range. Actual revenue may differ.
Bottom line: Read TSMC’s growth through one consistent currency and period before forming a market view. This educational analysis is not personalized investment advice.