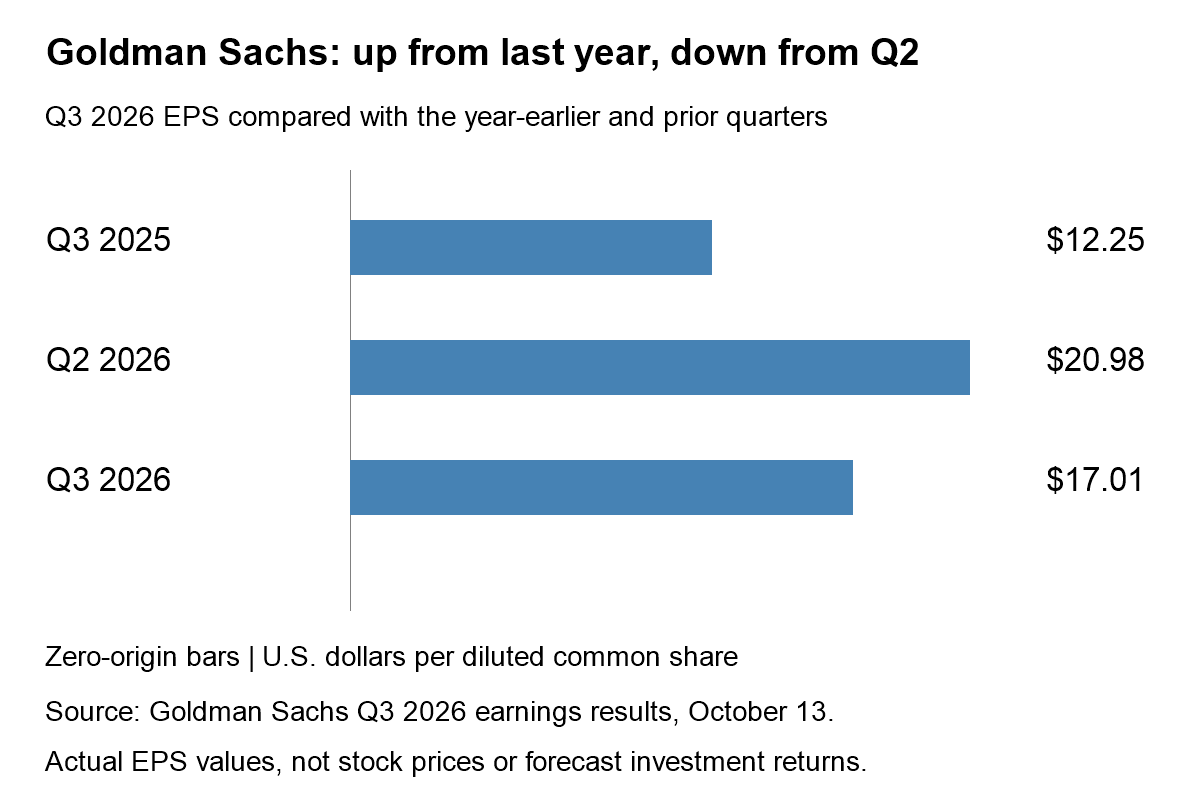
Quick answer: Goldman Sachs earnings improved from a year earlier but fell from the previous quarter. Q3 diluted EPS of $17.01 compares with $12.25 in Q3 2025 and $20.98 in Q2 2026. Both directions are true because the baselines differ.
Research checked October 13, 2026. These are published results for the quarter ended September 30—not an earnings forecast, analyst consensus or live GS share-price chart.
What did Goldman Sachs actually report?
The October 13 company release reports quarterly net revenues of $18.68 billion, net earnings of $5.29 billion and annualized return on average common equity of 18.7%. Annualized ROE is a profitability measure, not a promised one-year shareholder return.
The detailed Q3 results PDF provides the EPS comparisons and describes revenue as 23% higher year over year and 8% lower quarter over quarter. That makes a one-direction headline an incomplete description of the same report.
The EPS chart: growth depends on which quarter you choose
| Period | EPS | Role in comparison |
|---|---|---|
| Q3 2025 | $12.25 | Year-earlier baseline |
| Q2 2026 | $20.98 | Previous-quarter baseline |
| Q3 2026 | $17.01 | Current reported quarter |
MGI’s calculations using those published EPS values are:
- Year over year: ($17.01 ÷ $12.25 − 1) × 100 = approximately 38.9%.
- Quarter over quarter: ($17.01 ÷ $20.98 − 1) × 100 = approximately −18.9%.
These are changes in EPS, not changes in net income or the stock price. Adding 38.9% and −18.9% into a supposed “net growth” rate would be invalid: the denominators and periods differ. The chart keeps the actual dollar values visible so readers can reproduce each comparison.
Why a weaker sequential quarter is not automatically a collapse
Imagine a fictional service business earns 10 units one quarter, 18 the next and 15 afterward. Its latest result is below 18 but above 10. The arithmetic alone cannot distinguish a durable weakening from normalization after an unusually strong period. That requires additional evidence about volumes, pricing, costs and repeatability.
Apply the same discipline to Goldman without assuming that a hypothetical story describes the company. A year-earlier comparison can help control for seasonal timing, while a sequential comparison captures more recent direction. Neither is sufficient in isolation, and neither removes the need to inspect the mix of earnings.
The backlog check: completed fees are not future fees
The Q3 PDF reports investment banking fees of $3.22 billion, up 21% from a year earlier, while the investment banking fees backlog decreased from Q2. Recognized activity and a forward-looking pipeline answer different questions. Do not translate a strong reported fee quarter into guaranteed future transactions.
The next useful research step is not to invent a fourth-quarter EPS number. It is to track whether realized fees, the pipeline and management’s qualifications develop consistently over subsequent reports. Transactions can change timing or fail to complete; an attractive narrative needs a testable follow-up.
Four checks before interpreting the result as a stock signal
- Name the baseline. Write “versus Q3 2025” or “versus Q2 2026” beside every growth claim.
- Keep metrics distinct. Revenue, net earnings, diluted EPS and annualized ROE cannot be substituted for one another.
- Verify expectations separately. A comparison with last year does not show a beat against analyst consensus. Use a dated estimate with a matching accounting basis before making that claim.
- Verify market reaction separately. A reported result is not evidence of a rally. Use timestamped, comparable prices before describing a percentage stock move.
Our Goldman pre-release fee-quality checklist explains the original questions. The bank credit-loss guide helps keep provisions distinct from realized charge-offs when reading the wider earnings report.
Frequently asked questions
Did Goldman Sachs EPS grow in Q3 2026?
Yes against Q3 2025; no against Q2 2026. Specify the baseline to avoid a misleading answer.
Does 18.7% annualized ROE mean investors earned 18.7%?
No. Company return on equity and the return earned by a shareholder measure different things.
Bottom line: Goldman’s $17.01 EPS is a two-baseline story. Evaluate the composition and future evidence before turning either comparison into an investment conclusion. General financial education, not a buy or sell recommendation.