
Decoding America’s $1.2 Trillion Trade Deficit: Tariffs, Supply Chains, and the Future of Global Trade – The U.S. goods trade deficit reached a staggering $1.2 trillion in 2024, driven by record imports and widening gaps with key partners like Mexico, China, and Vietnam.
This imbalance has reignited debates over tariffs, manufacturing competitiveness, and geopolitical strategy. While the Trump administration has pursued aggressive trade policies—including 25% tariffs on Canada and Mexico and hikes on Chinese goods—the path to rebalancing remains fraught with complexity.
Asia: The Epicenter of U.S. Trade Imbalances
China: A Diminished but Dominant Player
Despite a 29% drop from its 2018 peak of $418 billion, the U.S. deficit with China remained the largest at $295 billion in 2024. Key drivers include:
- Electronics and Machinery : Smartphones, computers, and industrial equipment accounted for 40% of imports
- Tariff Evasion : Businesses shifted production to Vietnam and India to avoid U.S. tariffs, inadvertently swelling deficits with those nations
Vietnam: The New Manufacturing Powerhouse
Vietnam’s deficit with the U.S. surged to $123.5 billion in 2024, driven by apparel, footwear, and electronics 4. Analysts link this to supply chain diversification post-pandemic and U.S.-China trade tensions
India: Doubling Down on Tech and Machinery
The U.S.-India deficit doubled since 2017 to $34 billion, with machinery and electronics constituting 30% of imports. Apple’s shift to Indian iPhone production exemplifies this trend
North America: Mexico and Canada’s Ballooning Deficits

Mexico: A $172 Billion Challenge
Mexico surpassed China as the top U.S. import source in 2023. By 2024, the deficit had nearly tripled from Trump’s first term, fueled by autos, appliances, and agricultural goods. Over 45% of Mexican exports to the U.S. are vehicles and parts.
Canada: Energy and Autos Drive the Gap
Canada’s $63 billion deficit stemmed from $98 billion in crude oil exports and $35 billion in vehicles. Despite USMCA’s duty-free framework, Trump’s threatened tariffs on autos and agricultural goods have created uncertainty.
Europe: Surpluses and Deficits in Tandem

Netherlands and the U.K.: Energy and Aerospace Wins
The U.S. recorded a $56 billion surplus with the Netherlands (oil/gas exports) and a $12 billion surplus with the U.K. (aircraft and pharmaceuticals).
Ireland and Germany: Pharma and Auto Imbalances
Ireland : A $87 billion deficit, driven by $50 billion in pharmaceutical imports.
Germany : An $85 billion gap tied to vehicles and machinery.
Peter Navarro, Trump’s trade adviser, criticized the EU’s 10% auto tariff—double the U.S. 2.5% rate—as a “glaring asymmetry
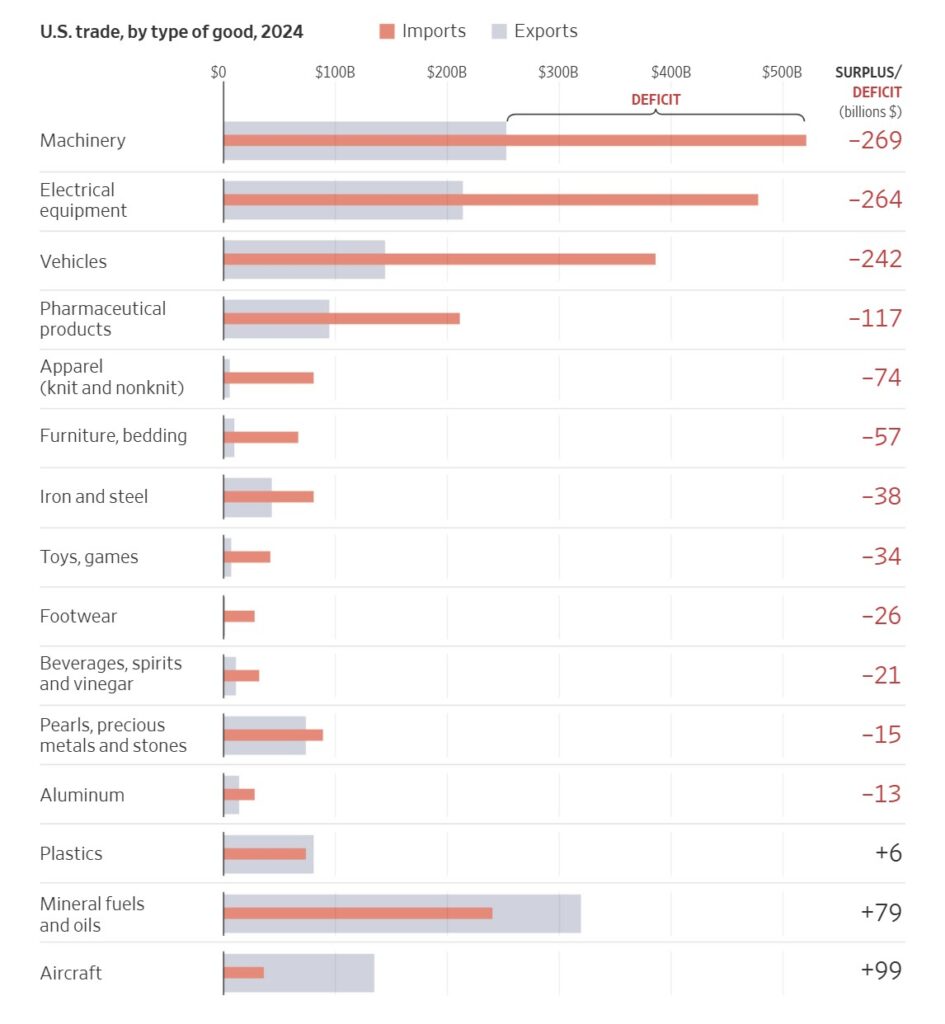
Sectoral Breakdown: Where Deficits Linger
Largest Deficits : Machinery/electronics ($412 billion), vehicles ($225 billion), pharmaceuticals ($118 billion).
Surpluses : Aircraft ($73 billion), mineral fuels ($68 billion)
Expert Insights: Tariffs, Competitiveness, and the Road Ahead
Dan Anthony, Trade Partnership Worldwide
“The U.S. must address non-tariff barriers, such as EU regulatory hurdles on autos, to achieve reciprocity,” argues Anthony.
Dr. Emily Blanchard, Dartmouth College
“Tariffs alone won’t shrink the deficit. Boosting U.S. competitiveness in high-value sectors like semiconductors and AI is critical,” she notes, citing the CHIPS Act as a step forward.
Dr. Mary Lovely, Peterson Institute
“China’s domestic demand shocks—from its property crisis to low consumer confidence—are reducing imports, which could narrow the deficit but strain global supply chains,” Lovely warns.
Risks and Opportunities
Retaliation and Escalation
China’s targeted tariffs on U.S. coal and LNG could escalate into broader trade wars 4.
Supply Chain Volatility
Over-reliance on Vietnam and India risks replicating vulnerabilities exposed by U.S.-China disputes.
Energy Exports: A Silver Lining
U.S. LNG and crude oil exports to Europe and Asia reached record highs in 2024, contributing to a $918 billion overall goods/services deficit.
Conclusion: Toward a Sustainable Trade Strategy
The $1.2 trillion deficit reflects structural shifts in global manufacturing, energy markets, and geopolitical tensions. While tariffs pressure trading partners, experts emphasize that long-term solutions require innovation, workforce development, and multilateral engagement.
As the U.S. navigates this fragmented landscape, businesses and policymakers must balance protectionism with strategic investments in competitive sectors.
https://www.wsj.com/economy/trade/us-trade-import-export-deficit-charts-490a7bce?mod=finance_lead_story
답글 남기기