A Cautious Outlook: The U.S. Economy in 2025 Navigates a Demand Slowdown – Recent economic data presents a complex and, for many, cautious picture of the American economy. Despite some surprising resilience in headline figures, a neutral and in-depth analysis reveals underlying signs of weakening consumer demand and a gradual softening of the labor market. This dynamic is a key factor in mitigating the inflationary pressure from new tariffs, setting the stage for a prudent and data-dependent stance from the Federal Reserve.
1. The Fraying Fabric of Consumer Demand
The U.S. consumer, a long-standing pillar of economic strength, is showing distinct signs of strain. While the latest retail sales figures from July were in line with expectations, a deeper look at the data reveals a slowdown in momentum. Real-term consumption, adjusted for inflation, has been decelerating. This is particularly evident in the service sector, where real spending has experienced a significant slowdown in the first half of 2025. The provided chart titled “Real Service Expenditure” visually highlights this trend, showing a clear dip in the annualized 6-month growth rate.
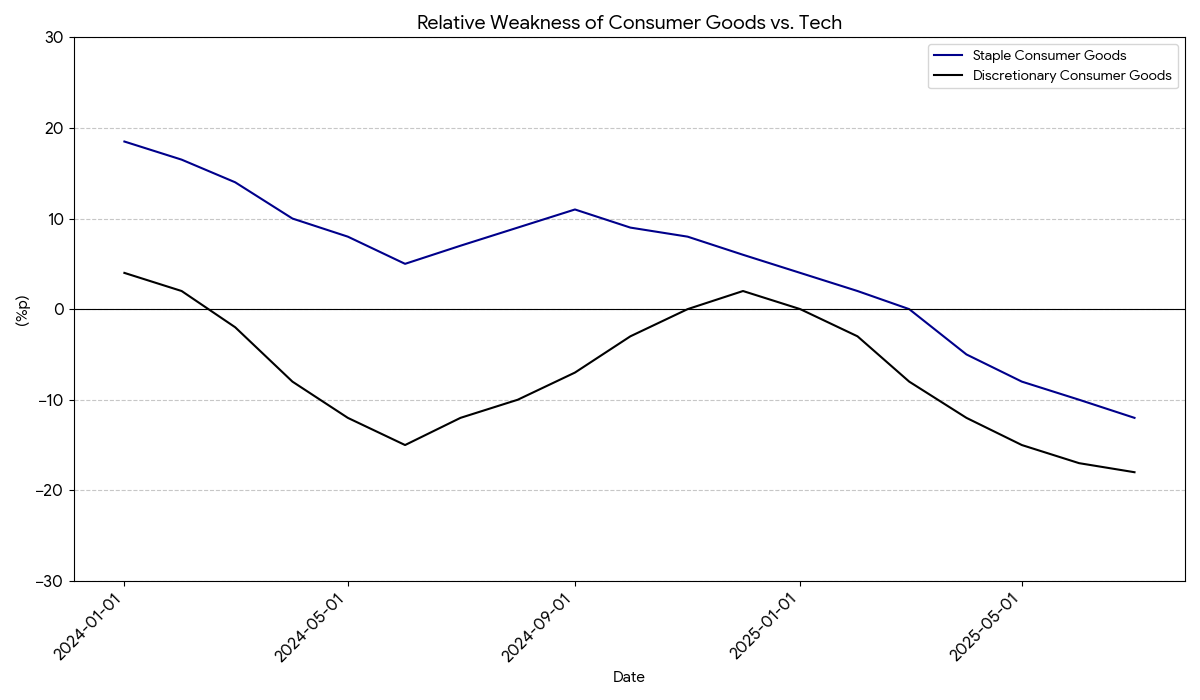
The behavior of the consumer is also reflected in the stock market. Consumer-related stocks, particularly those in the discretionary and staple goods sectors, have shown relative weakness compared to the high-flying tech sector. This disparity suggests that investors are anticipating a slowdown in consumer spending and are rotating into more growth-oriented or defensive plays. The chart “Consumer Goods Show Relative Weakness Compared to Tech” illustrates this trend, with both consumer goods indices consistently underperforming the tech index in 2025.
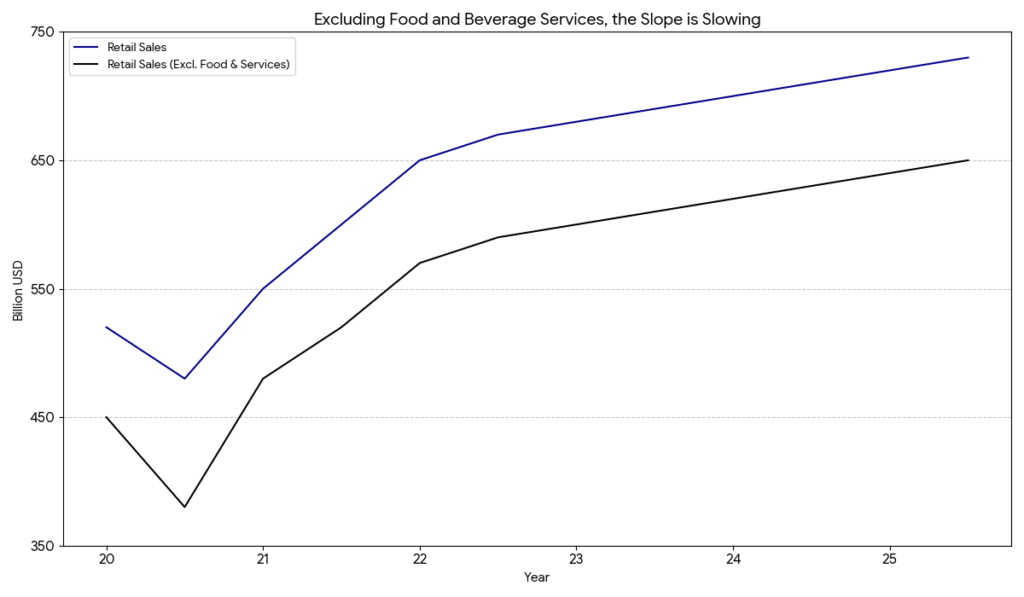
Furthermore, retail sales data, when analyzed with food and beverage services excluded, shows a moderating growth trajectory. While total retail sales continue to grow in nominal terms, the exclusion of these categories reveals a slowing slope, a sign of underlying weakness in discretionary spending on goods. The chart “Excluding Food and Beverage Services, the Slope is Slowing” confirms this divergence.
2. The Slowing Labor Market and Its Nuances
The U.S. labor market, long a source of strength, is showing signs of a gradual and controlled cooling. While the headline unemployment rate has not seen a sharp increase, this is largely due to a corresponding drop in the labor force participation rate. This is highlighted in the chart “Why Unemployment Rate Isn’t Rising: Falling Labor Force Participation Rate,” which separates the contributions of labor demand and supply to the unemployment rate.
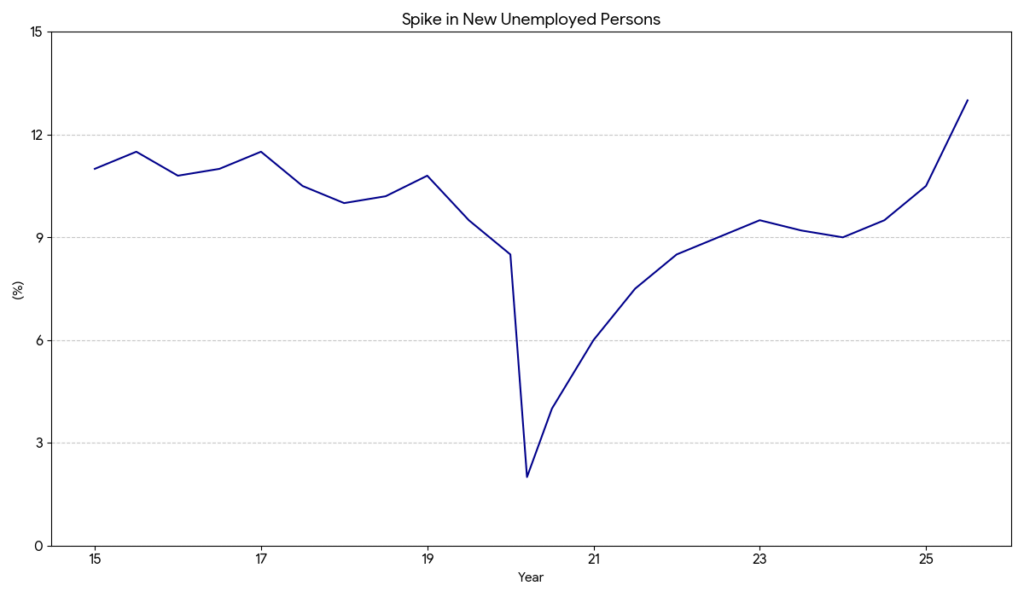
A more telling sign of labor market weakness is the recent increase in new unemployed persons. The chart “Spike in New Unemployed Persons” shows a sharp rise in new unemployment, signaling that while the overall unemployment rate may be stable, job losses are becoming more frequent.
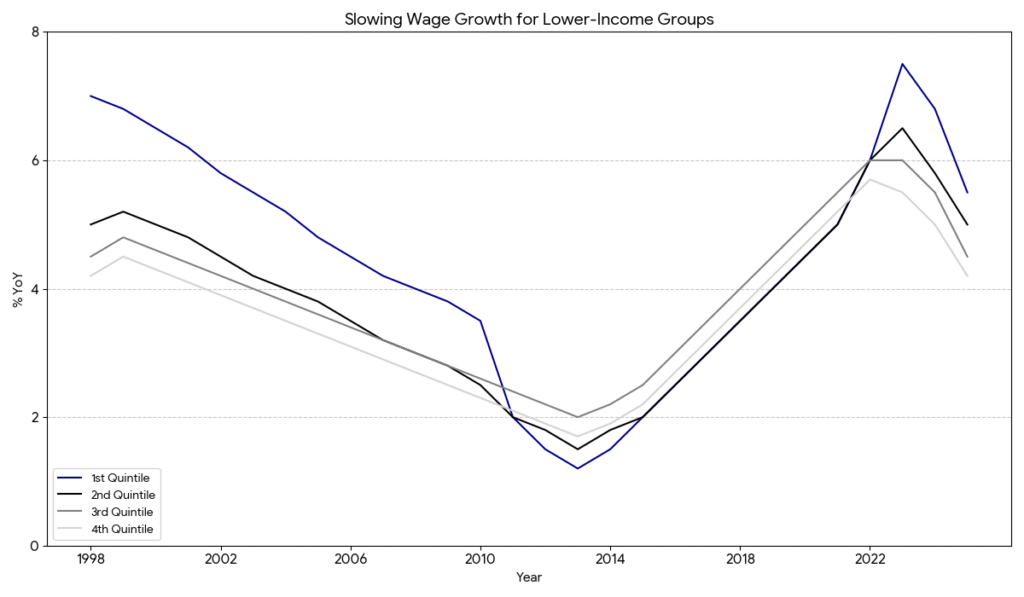
Wage growth is also following a decelerating trend, with a disproportionate impact on lower-income groups. The chart “Slowing Wage Growth for Lower-Income Groups” shows that while all income quintiles experienced a significant increase in wage growth during the post-pandemic period, the first quintile has seen a more rapid deceleration in recent months. This uneven slowdown in income growth could have a cascading effect, further constraining demand and consumption.
3. Tariffs’ Inflationary Impact Muted by Weak Demand
The recent imposition of tariffs raised concerns about a potential inflationary spike. However, the data suggests that these fears have been largely contained, primarily due to the existing weakness in consumer demand. The Producer Price Index (PPI) saw a slight rebound in July, with a notable increase in the service sector. The table “Service PPI-led Rise” shows a significant 2.0% month-over-month increase in the trade sector, suggesting that companies may finally be passing on tariff-related costs.
However, the overall inflationary impact on the consumer is expected to remain limited. Goods have a relatively small weight in the overall inflation basket, and other key components are showing signs of stabilization. The chart “If Housing Costs Stabilize, the Overall Index Will Stabilize” shows the close relationship between the Zillow Rent Index and the CPI Shelter component, suggesting that a stabilization in housing costs could anchor overall inflation.
The PPI data, when broken down by production stage, also suggests that the pass-through of costs is not yet widespread. The chart “PPI by Stage Trend” shows that while the final demand PPI has seen some volatility, the trends in upstream PPI stages do not signal an imminent, broad-based inflationary surge.
Conclusion: A Data-Dependent Fed and a New Economic Reality
The economic narrative of 2025 is defined by a delicate balance between external pressures and internal weaknesses. While tariffs pose a potential inflationary risk, the slowdown in consumer demand and a cooling labor market are acting as powerful counterweights. The Federal Reserve is likely to maintain a cautious, data-dependent stance.
Rather than committing to a series of aggressive cuts, they are expected to move prudently, perhaps signaling one or two rate cuts for the remainder of the year as they assess how these conflicting economic forces play out. This cautious approach reflects a new economic reality where the U.S. economy, after years of post-pandemic exuberance, is entering a period of necessary and prolonged recalibration.
https://www.oxfordeconomics.com/key-themes-2025
https://mgiedit.org/obbba-the-us-economys-new-path-in-2025-a-deep-dive/
답글 남기기